Consumer News 25 July 2025

Price Per Square Foot Survey 2025

Biggest cities see biggest price drops as Canadian homebuyers react to economic uncertainty

Annual Price per Square Foot survey looks at prices back to 2018 for almost 50 Canadian communities – finds condo prices in metro markets dip while smaller Prairie and Atlantic communities shoot up

Vancouver (July 28, 2025) – Century 21 Canada’s annual Price per Square Foot survey reveals Canada has no one real estate story. The often talked about major urban markets of the GTA and Greater Vancouver area have seen price declines and, across the board, sales volumes have declined this year.

But less talked about is the contrast seen in some smaller communities in Atlantic Canada, Alberta, and the Prairies, where prices are up 10 – 30 per cent this year – but to rates still far below those in other metro centers.

The annual survey compares the price per square foot of properties sold in almost 50 communities, large and small and in every province, between January 1 and June 30 this year to the same period of previous years. In many cases, it has data going back to 2018 for both metro centers and smaller communities.

“We’ve seen huge variations in pricing trends in the first half of 2025, as people in different communities adjust to headlines and the uncertainty caused by the tariff situation in different ways,” says Todd Shyiak, Executive Vice President of CENTURY 21 Canada. “The GTA is seeing the toughest market in years, while we’re seeing price strength in some Alberta, Saskatchewan, Manitoba, and Atlantic Canada communities. Anecdotally, we are hearing from agents that many clients are seeking livable communities with lower real estate prices this year, continuing a trend we started seeing during the pandemic.”

He adds the survey looks at pricing trends over several years across Canada, and that this year the pricing data needs to be taken in context of overall sales volumes slowing due to economic uncertainty.

“That said, there are early signs the market became somewhat more active in June, at the end of our survey period, but overall we anticipate a “wait and see” approach from many prospective buyers and sellers for the rest of the year,” Shyiak says.

According to this year’s data Alberta, Saskatchewan, and Manitoba saw a continuation of past year’s upward price per square foot trends, indicating a sustained interest in the relatively affordable homes of the Prairie region. In that region larger markets generally saw smaller increases, even a few nominal declines, while mid-sized markets such as Red Deer, AB and Brandon, MB saw double-digit rises.
The steepest increases across the country were in the Atlantic region, with New Brunswick seeing a big price per square foot increase for detached homes in Fredericton and St. John. Elsewhere in Atlantic Canada, home prices by square foot decreased in St. John’s, NL, but remained on par with 2021 – 2022 benchmarks.

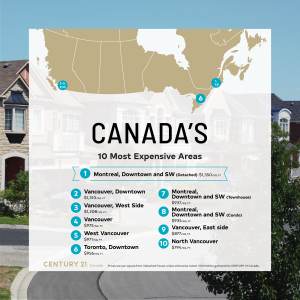
In the major city condo markets, the GTA experienced notable decreases, with most markets dipping to prices in line with those in 2022 and downtown Toronto dipping to the lowest level since 2018. Detached homes in the GTA have not been exempted, with Hamilton houses seeing the biggest percentage decrease in the region at 24 per cent. On the west coast, downtown Vancouver condos decreased in price a modest amount, though overall Metro Vancouver prices stepped back to about 2020 – 2021 levels as suburban house prices declined.

Notably, the sales volume in many metropolitan areas trended downward for the first half of this year, likely due to economic uncertainty caused by the tariffs imposed by the US, though many real estate boards report signs of an uptick going into the second half of the year.

Regional highlights:

Atlantic Canada

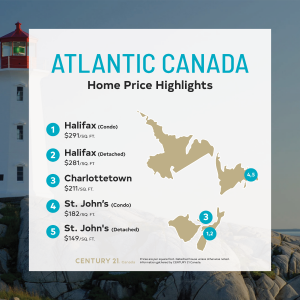
Markets in Atlantic Canada have been strong this year, especially in the New Brunswick region with Fredericton and St. John both seeing double-digit jumps in their detached home prices per square foot – still to levels below those in most other regions of Canada. Other markets saw more modest gains, and small dips can be observed in Halifax condos and Charlottetown detached homes. However, Halifax retained the jump in pricing seen after the 2021-2022 surge and Charlottetown remains above its 2023 benchmark, though remains one of the most affordable regions in the country.

“It’s definitely been a strong year,” says Krista Trask, agent with CENTURY 21 Sellers Choice in St. John’s, NL. “We’ve been kept busy and we’re seeing a lot of people who are more interested in moving here due to how affordable St. John’s is when compared to the rest of the country.”

“It was a little bit of a slow start in the first quarter, but June had strong numbers,” says Joel Ives with CENTURY 21 Colonial Realty in Charlottetown, PEI. “We had such an increase in the past five years that this year might have pumped the brakes a little and now our market has settled.”

British Columbia

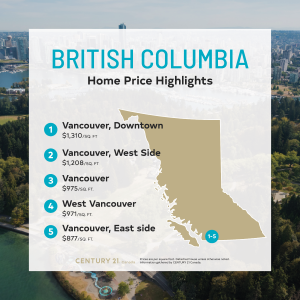
After years of steady upward price growth, BC is seeing the effects of uncertain buyers as both prices and sales volumes dropped. In most cases price declines have been moderate, though detached homes in Burnaby dropped 12 per cent to $791 per square foot and townhouses in Victoria were down 13 per cent to $392 per square foot. Current prices in both cases are still above 2021 levels, after steep increases in 2022 and 2023. In Chilliwack prices have cooled and remained steady after substantial gains since 2020.

In BC’s interior, the pattern of steady pricing continues, with moderate losses and gains. Kelowna saw losses between two to six per cent in all housing types except townhomes, which held steady. As buyers look for cheaper alternatives to the Greater Vancouver area, they might have to go farther outfield – new to the survey this year is Kitimat, which has the lowest PPSF in the country, with townhomes going for $168 per square foot.

Rhiannon Foster, an agent with CENTURY 21 In Town in Vancouver, BC, notes that this year has been a rollercoaster for buyers and sellers in the Lower Mainland. “We started off strong this year, but then came the complications from the tariffs and we saw a pause happen,” she explains. “In my experience, sellers are holding to their prices because they don’t have to sell immediately.

Right now, what I’m seeing is that sales are starting to pick up but we’re about to go into August, when real estate is not a top priority for people. So we’ll see a slowdown over the next few weeks no matter what, but we do expect a lot of inventory to come back in September. If there are sellers waiting, they’ll have competition then.”

Quebec

The price per square foot increases in the Montreal market of years past have continued on an upward trend, with condo prices rising 5 per cent to about the same level as they were in 2022, while detached house prices rose almost eight per cent.

Sebastien Bonnerot, Vice President of CENTURY 21 Quebec in Gatineau, Quebec notes that the price trends in Montreal have settled into a comfortable spot for future growth. “We’re not seeing the big jumps in prices that we saw four to five years ago, but we’ve also moved past that short period of decline that happened around 2023. The market in the Montreal area is strong, we have a lot of young buyers who want a city lifestyle and like the culture and affordability that Montreal has to offer, compared to markets in Ontario.”

Ontario

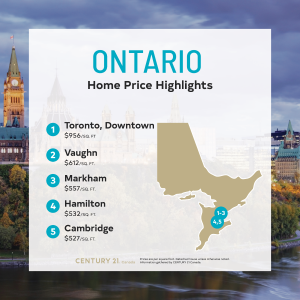
Ontario, more than any other region of the country, is feeling the most negative effects of the uncertain economic conditions. Condo and house prices in most GTA markets are down, most notably in Toronto proper, where condo prices dipped almost 12 per cent, and in Markham, where detached home prices dropped 22 percent.

Outside of the GTA, pricing changes were more moderate and mixed, with Ottawa emerging as a more popular market and seeing price increases – 22 per cent up for detached houses.

Nelson Goulart, with CENTURY 21 Signature Service, sees how buyers and sellers have hesitated to jump into the market. “They tend to take a position of ‘wait and see,’ similar to the 90’s. There are different factors now, but they’re concerned about qualifying at higher interest rates and once that uncertainly lifts, that’s when they’ll jump in.

“The market has perked up in the last few weeks, and at the end of the day, uncertainty will pass. There may be opportunity now to buy at reduced rates as long as people are looking for long-term investments and looking at the ‘why’ of their decision to purchase a home.”

Prairies

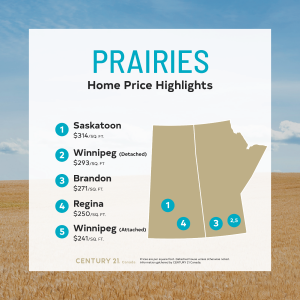
Overall, prices in the prairies were strong compared to the rest of the country. Only condos in Winnipeg fell in price, and then by just 1.5 per cent, while condos in Brandon, Manitoba saw the highest increases – riding 22 per cent in price per square foot. The relative affordability of this region continues to draw buyers looking for more value for their dollar.

Gary Busch, from CENTURY 21 Fusion in Saskatoon, Saskatchewan, notes that his province is the tortoise in the race – no huge changes, but steadily moving forward. “We’re probably going to see a big jump next year,” he notes. “We have jobs, and immigration both from within and outside of Canada. The people who come here are all skilled workers with above-average jobs, with good wages, so we’re building houses as fast as we can, and we have the advantage of still being affordable.”

Alberta

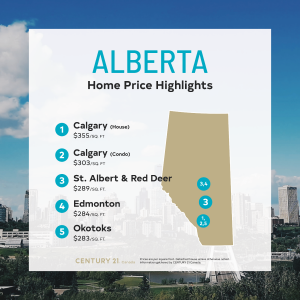
Alberta holds the distinction of being the only region that saw no drops in price per square foot, continuing a strong market trend observed in recent years. There are signs that some of the fervor around Calgary may have cooled – prices rose by less than one per cent – but smaller towns such as High River, Okotoks and Red Deer continued to see increases.

CENTURY 21 Canada’s annual survey of data on the price per square foot (PPSF) of properties gathers and compares sales data from its franchises across Canada from January 1 to June 30 of each year. By looking at the price per square foot at the same time each year the firm is able to get a good idea of how prices have changed over time for similar properties. This year’s survey compares 2024 prices with this year’s results.

Price Per Square Foot Survey Results 2025

ALBERTA 2018 2019 2020 2021 2022 2023 2024   % Change from 2024
Calgary House $341 $325 $320 $355 $396 $419 $470 $474 0.85%
Calgary Condo $329 $317 $296 $303 $326 $358 $421 $422 0.24%
Edmonton Detached House $288 $272 $268 $284 $297 $309 $317 $341 7.57%
Edmonton Duplex $275 $256 $250 $270 $287 $292 $303 $316 4.29%
Edmonton Condo $231 $220 $206 $217 $222 $204 $224 $241 7.59%
High River Detached House $193 $215 $237 $271 $307 $334 $382 $421 10.21%
High River Condo N/A $241 $173 $176 $223 $233 $285 $290 1.75%
Okotoks Detached House N/A $238 $254 $283 $338 $362 $394 $404 2.54%
Okotoks Condo N/A $254 $211 $219 $251 $288 $323 $371 14.86%
Red Deer Detached House $276 $262 $252 $289 $293 $294 $325 $359 10.46%
Red Deer Townhouse N/A N/A N/A $207 $214 $226 $222 $263 18.47%
St. Albert Detached House $287 $271 $269 $289 $322 $317 $322 $349 8.39%
St. Albert Condo $239 $223 $211 $251 $238 $259 $255 $273 7.06%
St. Albert Duplex $262 $272 $278 $280 $325 $347 $301 $336 11.63%
BRITISH COLUMBIA 2018 2019 2020 2021 2022 2023 2024   % Change from 2024
Chilliwack Detached House $297 $294 $288 $406 $515 $419 $427 $429 0.47%
Chilliwack Townhouse $267 $249 $250 $318 $425 $359 $379 $378 -0.26%
Chilliwack Condo/ Apartment $283 $290 $270 $351 $473 $443 $437 $459 5.03%
Kelowna Detached House $283 $274 $280 $368 $463 $413 $417 $408 -2.16%
Kelowna Half Duplex $247 $260 $263 $320 $402 $362 $393 $366 -6.87%
Kelowna Townhouse $292 $287 $302 $365 $452 $422 $422 $422 0.00%
Kelowna Apartment $345 $348 $334 $411 $526 $491 $482 $467 -3.11%
Vancouver Detached House $856 $769 $816 $975 $1,177 $978 $890 $860 -3.37%
Vancouver, Downtown Condo $856 $769 $1,060 $1,053 $1,133 $1,132 $1,264 $1,206 -4.59%
Vancouver, East side Detached House $721 $647 $672 $877 $957 $829 $977 $945 -3.28%
Vancouver, West Side Detached House $1,147 $990 $1,004 $1,208 $1,421 $1,149 $1,161 $1,110 -4.39%
Burnaby Detached House $599 $551 $579 $688 $795 $879 $900 $791 -12.11%
West Van Detached House $899 $738 $734 $971 $1,038 $930 $1,037 $958 -7.62%
Vancouver, Richmond Detached House $677 $598 $608 $722 $831 $773 $831 $776 -6.62%
Delta North Detached House $423 $400 $413 $570 $716 $594 $618 $594 -3.88%
North Vancouver Detached House $681 $613 $690 $794 $910 $817 $937 $922 -1.60%
White Rock/South Surrey Detached House $506 $472 $435 $625 $795 $627 $724 $689 -4.83%
Victoria Detached House N/A N/A N/A $558 $592 $602 $567 $577 1.76%
Victoria Townhouse N/A N/A N/A $457 $583 $553 $452 $392 -13.27%
Victoria Condo N/A N/A N/A $659 $676 $723 $694 $681 -1.87%
Kitimat Townhouse               $168  
Kitimat Detached House               $228  
ATLANTIC 2018 2019 2020 2021 2022 2023 2024   % Change from 2024
Charlottetown Detached House $147 $165 $178 $211 $245 $235 $252 $250 -0.79%
Fredericton Detached House N/A $99 $123 $147 $170 $196 $196 $248 26.53%
Halifax Detached House $155 $162 $170 $281 $408 $398 $414 $436 5.31%
Halifax Condo $228 $239 $270 $291 $450 $467 $467 $461 -1.28%
Moncton Detached House $101 $106 $124 $142 $173 $197 $237 $244 2.95%
Saint John Detached House N/A $111 $123 $134 $163 $192 $186 $246 32.26%
St. John’s Detached House N/A $132 $135 $149 $167 $167 $226 $250 10.62%
St. John’s Condo N/A $174 $116 $182 $212 $205 $310 $319 2.90%
PRAIRIES 2018 2019 2020 2021 2022 2023 2024   % Change from 2024
Regina Detached House $254 $246 $237 $250 $284 $275 $290 $298 2.76%
Regina Condo $236 $213 $205 $205 $194 $189 $227 $227 0.00%
Saskatoon Detached House $270 $263 $263 $314 $336 $344 $370 $377 1.89%
Saskatoon Condo $208 $213 $217 $216 $219 $226 $247 $265 7.29%
Winnipeg Detached House $282 $243 $244 $293 $315 $291 $302 $328 8.61%
Winnipeg Condo $261 $220 $223 $234 $254 $249 $271 $267 -1.48%
Winnipeg Attached N/A $202 $210 $241 $269 $258 $272 $288 5.88%
Brandon Detached House $248 $246 $248 $271 $276 $276 $291 $299 2.75%
Brandon Condo $196 $204 $204 $203 $243 $236 $234 $269 14.96%
ONTARIO 2018 2019 2020 2021 2022 2023 2024   % Change from 2024
Barrie Detached House $283 $350 $350 $378 $503 $576 $579 $600 3.63%
Bradford Detached House $286 $345 $358 $410 $580 $535 $530 $569 7.36%
Cambridge Detached House $332 $355 $388 $450 $625 $568 $568 $555 -2.29%
Cambridge Condo $344 $347 $367 $435 $716 $514 $530 $517 -2.45%
Cambridge Townhouse $282 $317 $341 $474 $616 $490 $500 $519 3.80%
Grey Bruce Detached House $175 $182 $195 $357 $455 $406 $415 $418 0.72%
Guelph Detached House $397 $409 $443 $483 $690 $627 $618 $633 2.43%
Guelph Condo $374 $402 $423 $511 $777 $482 $480 $473 -1.46%
Guelph Duplex $348 $362 $400 $451 $648 $523 $525 $547 4.19%
Guelph Townhouse $311 $335 $364 $433 $641 $580 $573 $470 -17.98%
Hamilton Detached House $362 $378 $406 $532 $553 $523 $509 $385 -24.36%
Hamilton Townhouse $257 $350 $343 $453 $538 $508 $507 $451 -11.05%
Kitchener Detached House $339 $359 $400 $430 $618 $610 $605 $598 -1.16%
Kitchener Townhouse N/A $323 $342 $435 $576 $487 $490 $470 -4.08%
Kitchener Condo $328 $362 $399 $483 $800 $516 $491 $446 -9.16%
London Detached House $191 $237 $250 $362 $466 $466 $463 $475 2.59%
Markham Detached House N/A N/A $485 $557 $685 $841 $822 $635 -22.75%
Niagara Falls Detached House N/A $275 $300 $390 $531 $514 $505 $503 -0.40%
Newmarket Detached House N/A $372 $510 $505 $516 $704 $693 $570 -17.75%
Ottawa Detached House $225 $258 $313 $429 $465 $587 $607 $741 22.08%
Ottawa Townhouse N/A N/A N/A $392 $451 $566 $534 $618 15.73%
Ottawa Condo $442 $485 $577 $479 $583 $538 $550 $594 8.00%
Owen Sound Detached House $145 $158 $167 $312 $380 $361 $362 $391 8.01%
Richmond Hill Detached House $445 $465 $522 $520 $665 $813 $806 $647 -19.73%
Sault Ste. Marie Detached House             $298 $306 2.68%
Sault Ste. Marie Condo             $328 $296 -9.76%
St. Catharines Detached House $310 $290 $330 $400 $612 $528 $523 $567 8.41%
Toronto, Downtown Condo $903 $994 $1,083 $956 $795 $739 $706 $622 -11.90%
Vaughn Detached House $434 $503 $548 $612 $695 $772 $776 $621 -19.97%
Waterloo Detached House N/A $372 $407 $421 $613 $603 $601 $674 12.15%
Waterloo Townhouse N/A $324 $344 $408 $641 $486 $489 $531 8.59%
Waterloo Condo N/A $402 $411 $503 $777 $525 $498 $571 14.66%
Windsor Detached House N/A $372 $407 $295 $306 $469 $364 $394 8.24%
QUEBEC 2018 2019 2020 2021 2022 2023 2024   % Change from 2024
Montreal, Downtown and SW Condo $282 $289 $431 $498 $456 $439 $517 $545 5.42%
Montreal, Downtown and SW Detached House $211 $222 $366 $433 $500 $467 $485 $523 7.84%


Consumer News 2 August 2023

Price Per Square Foot Survey 2023

Interest rate hikes prompt modest decline in Canadian home prices, but no freefall in sight, impact uneven

Vancouver (Aug 2, 2022) – Canadian housing prices have fallen with rising interest rates, but when looking back over even just two years remain on a long-term upward trend. Even then, the situation is uneven. The hot housing markets of the biggest city centres are seeing lower condo prices but smaller markets are seeing price per square foot growth, especially in single-family homes. Alberta bucked the trend and experienced price increases in many markets this year, while other Prairie provinces held steady. BC saw the most significant price declines.

The seventh annual Price per Square Foot survey is being released by CENTURY 21 Canada, comparing the price per square foot of properties sold between January 1 and June 30 this year to the same period of previous years.

Notably, most markets that did experience price declines from last year remained roughly equivalent to their 2021 benchmarks and well above earlier years. This year’s survey offers data going back to 2018 for numerous communities coast-to-coast.

“We knew that the market had to come down from the highs of the last few years, and we’re now fully seeing the effects of the interest rate growth that started last year,” says Todd Shyiak, Executive Vice President of CENTURY 21 Canada. “But we have to look at these numbers within the larger context. The fact that we haven’t dipped to pre-pandemic levels shows that homes are still in demand, and we continue to see growth in smaller markets as more families seek a lower cost of living.”

Prices had reached low points in January but steadily climbed over the spring, though many markets didn’t manage to regain their 2022 levels. Condos in Vancouver, Toronto and Montreal all saw declines, while detached homes across small Ontario cities rose, as did those in Atlantic Canada, indicating families seeking space. New Brunswick is emerging as a leader in Atlantic Canadian growth. Results from the 2021 census showed that Moncton, Fredericton and St. John are seen as popular locations for immigrants, and the results from this year’s PPSF survey indicate that trend has continued.

Shyiak says that inventory will play a major factor in prices going forward, as sellers may hold off on putting their homes on the market in response to a hesitant buyer base. “Ultimately, we don’t know what the next six months holds for our housing prices, but it’s important not to get too focused on any single year and look at each data point within the larger context of ever evolving trends. That’s why this survey becomes more valuable year-over-year, because it allows us to see the big picture of Canadian housing.”


Regional highlights:

Atlantic Canada

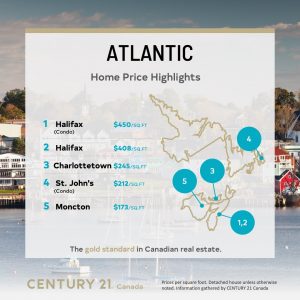
Prices in Atlantic Canada have continued to rise as Canadians from expensive urban markets seek a lower cost of living. For the first year since this survey started Halifax has lost its crown as the market with the steepest rise as condos in that city saw the smallest increase in the region after a sharp double-digit increase last year. Detached homes in Fredericton, Moncton and St. John’s all saw double-digit increases.

“Families are finding this to be a great place to settle down. We’ve been seeing these trends for years but post-2020 is when it really took off,” says Paul Burns, Manager at CENTURY 21 A&T Countryside Realty. “Interest rates may have slowed the market down slightly, but I’m confident New Brunswick especially will continue to grow.”


British Columbia Alberta Price Per Square Foot 2023

British Columbia

The steep prices throughout BC seem to have finally reached their cooling point, with the province seeing the steepest price declines but generally to levels still at or above those from 2021. Even then, Vancouver boasts some of the most expensive price per square foot dwellings in Canada, and prices of both detached houses and condos in the surrounding suburbs remain comparatively high.

Cities farther from the metropolitan core such as Chilliwack and Kelowna have also seen dips, though prices climbed throughout the spring to remain above 2021 levels. The only BC region to see growth was Victoria, possibly indicating more Lower Mainlanders searching across the water for cheaper real estate.


Quebec Price Per Square Foot 2023

Quebec

Like the other Canadian metropolises, Montreal saw a dip in the price of condos and detached homes, but unlike Vancouver and Toronto the decline was modest and in the single digits. “A lot of young buyers like Montreal, and that’s helped keep the markets here relatively stable,” says Mohamad Al-Hajj, owner of CENTURY 21 Immo-Plus. “We’ll keep an eye on how the rest of the year goes, but it does look like things will remain steady.”


Ontario Price Per Square Foot 2023

Ontario

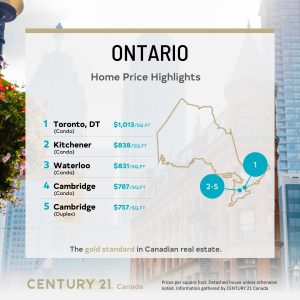
Canada’s most populous province saw a wide range of change throughout, from declines to rises all over the map. Toronto condos remain expensive at a PPSF of $1,013, though this is a 16 per cent drop from 2022 to a level roughly in line with 2021 and 2020 prices. However, cities like Niagara Falls and Cambridge saw their family home types gain in the double-digits, and they lead an overall trend of cities farther away from the GTA seeing growth in the price of single-family homes.

“The trend of families looking for space away from the downtown core continues,” says Eryn Richardson, owner of CENTURY 21 Heritage Group. “The changing interest rates definitely had an impact on the prices as buyers are more hesitant, but no single market has fallen dramatically and we’re still seeing a lot of growth.”


Prairies Price Per Square Foot 2023 

Prairies

The Prairies have remained relatively steady with minor gains and losses across the board. Saskatoon detached homes lead the pack at a PPSF of $344, a testament to families who come to the region for space and lower costs. Winnipeg, Brandon and Regina continue the trend, seeing their detached single family homes at $291, $276 and $275 respectively. The most significant decline was in Winnipeg, but even there detached homes fell just 7.62 per cent in price per square foot – the moderate change reflecting the stability of the region.


Alberta Price Per Square Foot 2023

Alberta

Overall, Alberta has seen the most growth over the past year, with consistent price per square foot gains in most markets. Growth was modest but steady over the first half of 2023, and regions that saw declines dipped no further than 2020 levels. Edmonton condos were among those to decline, a potential sign of younger and newer buyers being affected by rising interest rates.

However, condos in Okotoks rose 14 per cent in price, a good indication that smaller towns still have the potential to grow fast as buyers explore new options. Just north, Calgary saw a rise of 5.81 per cent in single-family homes and 9.82 per cent in condos, while Red Deer was largely unchanged.

“Alberta has really emerged as a viable option for a lot of buyers who are leaving the more expensive areas of BC. Buyers both young and established are finding homes that fit their needs,” says George Bamber, owner of CENTURY 21 Bamber Realty. “Not only are they getting cheaper housing, but they’re also finding vibrant and fast-growing communities that they can make their own.”


CENTURY 21 Canada’s annual survey of data on the price per square foot (PPSF) of properties gathers and compares sales data from its franchises across Canada from January 1 to June 30 of each year. By looking at the price per square foot at the same time each year the firm is able to get a good idea of how prices have changed over time for similar properties. This year’s survey compares 2022 prices with this year’s results.

See the full PPSF study results below.

ALBERTA House Type 2018 2019 2020 2021 2022 2023 % Change from 2022
Calgary House $341 $325 $320 $355 $396 $419 5.81%
Calgary Condo $329 $317 $296 $303 $326 $358 9.82%
Edmonton Detached House $288 $272 $268 $284 $297 $309 4.04%
Edmonton Duplex $275 $256 $250 $270 $287 $292 1.74%
Edmonton Condo $231 $220 $206 $217 $222 $204 -8.11%
High River Detached House $193 $215 $237 $271 $307 $334 8.79%
High River Condo N/A $241 $173 $176 $223 $233 4.48%
Okotoks Detached House N/A $238 $254 $283 $338 $362 7.10%
Okotoks Condo N/A $254 $211 $219 $251 $288 14.74%
Red Deer Detached House $276 $262 $252 $289 $293 $294 0.34%
Red Deer Townhouse N/A N/A N/A $207 $214 $226 5.61%
Red Deer Condo N/A N/A N/A $186 $194 $196 1.03%
Red Deer Duplex N/A N/A N/A N/A $269 $264 -1.86%
St. Albert Detached House $287 $271 $269 $289 $322 $317 -1.55%
St. Albert Condo $239 $223 $211 $251 $238 $259 8.82%
St. Albert Duplex $262 $272 $278 $280 $325 $347 6.77%


BRITISH COLUMBIA House Type 2018 2019 2020 2021 2022 2023 % Change from 2022
Chilliwack Detached House $297 $294 $288 $406 $515 $419 -18.64%
Chilliwack Townhouse $267 $249 $250 $318 $425 $359 -15.53%
Chilliwack Condo/ Apartment $283 $290 $270 $351 $473 $443 -6.34%
Kelowna Detached House $283 $274 $280 $368 $463 $413 -10.80%
Kelowna Half Duplex $247 $260 $263 $320 $402 $362 -9.95%
Kelowna Townhouse $292 $287 $302 $365 $452 $422 -6.64%
Kelowna Apartment $345 $348 $334 $411 $526 $491 -6.65%
Vancouver Detached House $856 $769 $816 $975 $1,177 $978 -16.91%
Vancouver, Downtown Condo $856 $769 $1,060 $1,053 $1,133 $1,132 -0.09%
Vancouver, East side Detached House $721 $647 $672 $877 $957 $829 -13.38%
Vancouver, West Side Detached House $1,147 $990 $1,004 $1,208 $1,421 $1,149 -19.14%
Burnaby Detached House $599 $551 $579 $688 $795 $725 -8.81%
West Van Detached House $899 $738 $734 $971 $1,038 $930 -10.40%
Vancouver, Richmond Detached House $677 $598 $608 $722 $831 $773 -6.98%
Delta North Detached House $423 $400 $413 $570 $716 $594 -17.04%
North Vancouver Detached House $681 $613 $690 $794 $910 $817 -10.22%
White Rock/South Surrey Detached House $506 $472 $435 $625 $795 $627 -21.13%
Victoria Detached House N/A N/A N/A $558 $592 $602 1.69%
Victoria Townhouse N/A N/A N/A $457 $583 $553 -5.15%
Victoria Condo N/A N/A N/A $659 $676 $723 6.95%


ATLANTIC House Type 2018 2019 2020 2021 2022 2023 % Change from 2022
Charlottetown Detached House $147 $165 $178 $211 $245 $235 -4.08%
Fredericton Detached House N/A $99 $123 $147 $170 $196 15.29%
Halifax Detached House $155 $162 $170 $281 $408 $398 -2.45%
Halifax Condo $228 $239 $270 $291 $450 $467 3.78%
Moncton Detached House $101 $106 $124 $142 $173 $197 13.87%
Saint John Detached House N/A $111 $123 $134 $163 $192 17.79%
St. John’s Detached House N/A $132 $135 $149 $167 $167 0.00%
St. John’s Condo N/A $174 $116 $182 $212 $205 -3.30%


PRAIRIES House Type 2018 2019 2020 2021 2022 2023 % Change from 2022
Regina Detached House $254 $246 $237 $250 $284 $275 -3.17%
Regina Condo $236 $213 $205 $205 $194 $189 -2.58%
Saskatoon Detached House $270 $263 $263 $314 $336 $344 2.38%
Saskatoon Condo $208 $213 $217 $216 $219 $226 3.20%
Winnipeg Detached House $282 $243 $244 $293 $315 $291 -7.62%
Winnipeg Condo $261 $220 $223 $234 $254 $249 -1.97%
Winnipeg Attached N/A $202 $210 $241 $269 $258 -4.09%
Brandon Detached House $248 $246 $248 $271 $276 $276 0.00%
Brandon Condo $196 $204 $204 $203 $243 $236 -2.88%


ONTARIO House Type 2018 2019 2020 2021 2022 2023 % Change from 2022
Barrie Detached House $283 $350 $350 $378 $503 $524 4.17%
Bradford Detached House $286 $345 $358 $410 $580 $617 6.38%
Cambridge Detached House $332 $355 $388 $450 $625 $670 7.20%
Cambridge Duplex $311 $331 $377 $527 $656 $757 15.40%
Cambridge Condo $344 $347 $367 $435 $716 $787 9.92%
Cambridge Townhouse $282 $317 $341 $474 $616 $575 -6.66%
Grey Bruce Detached House $175 $182 $195 $357 $455 $434 -4.62%
Guelph Detached House $397 $409 $443 $483 $690 $527 -23.62%
Guelph Condo $374 $402 $423 $511 $777 $740 -4.76%
Guelph Duplex $348 $362 $400 $451 $648 $691 6.64%
Guelph Townhouse $311 $335 $364 $433 $641 $605 -5.62%
Hamilton Detached House $362 $378 $406 $532 $553 $530 -4.16%
Hamilton Townhouse $257 $350 $343 $453 $538 $482 -10.41%
Kitchener Detached House $339 $359 $400 $430 $618 $610 -1.29%
Kitchener Semi-Detached N/A $341 $399 $460 $623 $632 1.44%
Kitchener Townhouse N/A $323 $342 $435 $576 $583 1.22%
Kitchener Condo $328 $362 $399 $483 $800 $838 4.75%
London Detached House $191 $237 $250 $362 $466 $384 -17.60%
Markham Detached House N/A N/A $485 $557 $685 $753 9.93%
Niagara Falls Bungalow N/A $336 $395 $475 $630 $746 18.41%
Niagara Falls Detached House N/A $275 $300 $390 $531 $606 14.12%
Newmarket Detached House N/A $372 $510 $505 $516 $536 3.88%
Ottawa Detached House $225 $258 $313 $429 $465 $502 7.96%
Ottawa Townhouse N/A N/A N/A $392 $451 $419 -7.10%
Ottawa Condo $442 $485 $577 $479 $583 $552 -5.32%
Owen Sound Detached House $145 $158 $167 $312 $380 $393 3.42%
Richmond Hill Detached House $445 $465 $522 $520 $665 $717 7.82%
St. Catharines Bungalow $385 $367 $425 $520 $589 $639 8.49%
St. Catharines Detached House $310 $290 $330 $400 $612 $636 3.92%
Toronto, Downtown Condo $903 $994 $1,083 $956 $1,217 $1,013 -16.76%
Vaughn Detached House $434 $503 $548 $612 $695 $687 -1.15%
Waterloo Detached House N/A $372 $407 $421 $613 $520 -15.17%
Waterloo Semi-detached N/A $357 $399 $439 $648 $663 2.31%
Waterloo Townhouse N/A $324 $344 $408 $641 $651 1.56%
Waterloo Condo N/A $402 $411 $503 $777 $831 6.95%
Windsor Detached House N/A $372 $407 $295 $306 $469 53.27%


QUEBEC House Type 2018 2019 2020 2021 2022 2023 % Change from 2022
Montreal, Downtown and SW Condo $567 $709 $805 $935 $935 $879 -5.99%
Montreal, Downtown and SW Detached House $603 $674 $958 $1,350 $1,357 $1,235 -8.99%
Consumer News 27 July 2022

Despite Interest Rate Hikes, National Home Prices see Steady Rises across The Country in First Half of The Year

Vancouver (July 27, 2022) – While interest rates have been on the rise for the past few months, the Canadian housing landscape continued to see pricing growth during the first six months of this year. Prices were up particularly in suburbs and smaller communities outside metropolitan centres as more condo owners seek homes outside of the expensive Greater Toronto Area and Vancouver centres.

The sixth annual Price Per Square Foot survey released today by CENTURY 21 Canada shows that real estate continued to be a strong market for the first half of the year, with long-term growth continuing despite higher interest rates and concerns about what that will mean for the industry in the immediate future. While some markets have cooled after the boom that occurred during the COVID-19 pandemic, prices overall have continued to remain elevated for the start of the year.

In its annual, nationwide study, CENTURY 21 Canada compared the price per square foot of properties sold between January 1 and June 30 this year to the same period last year and in previous years.

“We recognize the concerns that some might have because of interest rates, but the first half of 2022 showed growth in nearly every regional market in the country,” says Brian Rushton, Chief Operating Officer of CENTURY 21 Canada. “The highest point of the boom may have passed, but the trend is still towards higher prices, especially in suburbs where younger and first-time home buyers are looking to escape competitive metropolitan areas now that remote work has become more common. What will be interesting is to compare the data we’ve received from the first half of this year with the data we gather in 2023 to see how the rising rates impact the market for the next six months.”

After high prices in January across the board, prices saw market-typical fluctuations throughout the spring, with most markets experiencing slight downturns in June when the rate hikes came into effect. However, that has not stopped the demand for housing, particularly in the communities of Hamilton, Kitchener and Cambridge in Ontario and communities such as Chilliwack and Kelowna in BC. Atlantic Canada has also continued a sharp upward trend, with Halifax condos seeing a 54 per cent price increase in the first half of the year. Though the market may see a downturn across the board in the next six months, prices in these fast-growing smaller cities will still likely see double-digit growth in 2023, continuing the upward pressure seen over the past five years.

Rushton says that market trends are evolving rapidly as the full effect of the rate changes will come into effect in the latter half of 2022. “We don’t want to get ahead of ourselves, we’re going to keep seeing how the market performs and whether or not it cools down after the frenzy of the past year. With inflation on the rise, folks may be less able to purchase but even a slight dip would only take us to the level of a few years back, possibly the 2018-2019 period. Ultimately, there are still buyers who have been waiting for a cool down period so that they can enter the market at the best time.”


Regional highlights:


Alberta

Price Per Square Foot 2022 - Alberta

Moderate increases can be seen across regions in Alberta as investors from the GTA take advantage of growing smaller markets. While larger cities saw incremental growth, Okotoks and High River experienced double-digit increases, especially in their condo markets. The only decrease in this province can be found in St. Albert condos, though an increased PPSF in detached homes and duplexes indicate more families looking to grow in the suburbs.


Atlantic

Price Per Square Foot 2022 - Atlantic

Atlantic Canada was again a hot market this year for young and first-time buyers who have been unable to purchase in other, larger metros. Halifax condo prices continued their meteoric rise, with a heavy demand for detached homes not that far behind. Double-digit increases are seen throughout the region.

“Everyone is eager to find a place where they can put down roots, and once the remote work mandates from the pandemic became permanent, we haven’t seen any signs of this market slowing down in the first half of the year,” says David Yetman, Owner of CENTURY 21 All Points. “The biggest question for the next year will be if the supply can keep up with the demand. While prime interest rates have had a slowing effect, it is temporary, the current BoC rate is still extremely low and it bodes well for a healthy Halifax Regional Municipality (HRM) market going forward.”


British Columbia

Price Per Square Foot 2022 - British Columbia

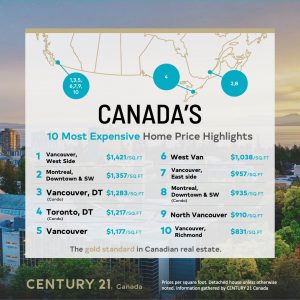
Once again, BC real estate takes the top place as the most expensive market in the country, particularly in detached homes in Vancouver’s West Side. However, the high prices may see buyers moving away from the downtown core as condo prices have only seen a slight increase this year (though remains the second highest local market, with a PPSF of $1,283) while prices rose sharply in communities such as Kelowna and Chilliwack, where condos saw a 28 per cent and 35 per cent increase in price respectively in the first half of the year.


Quebec

The Montreal condo market has held steady over the past year, with no increase to their PPSF of $935/sf. With the change in interest rates, there is the possibility of younger buyers who have been looking east in the recent years choosing to remain in their home province should prices trend down.

“The next six months will be watched very carefully to see how buyers, especially younger buyers, react to the changing interest rates,” says Mohamad Al-Hajj, owner of CENTURY 21 Immo-Plus. “While some may wait to see if there are any more changes, other buyers may see an opportunity to not have to move away from their communities.”


Ontario

Price Per Square Foot 2022 - Ontario

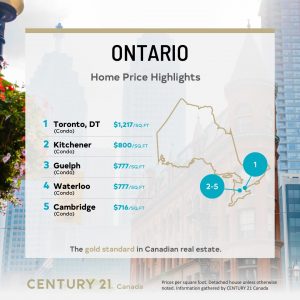
More buyers are leaving the Greater Toronto Area to seek homes in the communities such as Waterloo, Guelph and Hamilton. Guelph now stands at $777/sq ft, and Cambridge condos aren’t far behind at $716/sq ft.

Communities farther outside the GTA also saw substantial increases. Barrie saw a double digit increase in its detached home prices, as did Grey Bruce. As for the city of Toronto, after a slight downturn this time last year, prices have once agent risen to be the second highest in the country.


Prairies

Price Per Square Foot 2022 - Prairies

The Prairies have seen a more modest growth in pricing than the rest of the country, but there have been rises across Manitoba and Saskatchewan. While Regina condo prices took a slight dip, the region’s detached homes are up by 13 per cent in the first six months of 2022. Winnipeg follows the trend, though at a lower growth rate of 11 per cent, and Saskatoon at seven per cent. Brandon may be an emerging market for younger buyers – while detached homes only saw a very slight single digit increase condos are up by nearly 20 per cent to $243/sq ft. Overall, prices in Prairie provinces have remained the steadiest over the past several years.

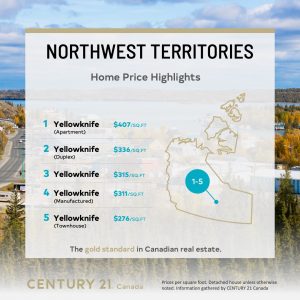
Price Per Square Foot 2022 - Northwest Territories

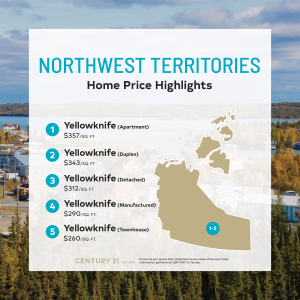
The upward trend of condos was even seen in Yellowknife, where a 14 per cent increase now sees the average apartment selling for $407/sq ft. More modest changes were seen across detached homes and townhouses, and only duplexes saw a small decrease.

CENTURY 21 Canada’s annual survey of data on the price per square foot (PPSF) of properties gathers and compares sales data from its franchises across Canada from January 1 to June 30 of each year. By looking at the price per square foot at the same time each year the firm is able to get a good idea of how prices have changed over time for similar properties. This year’s survey compares 2021 prices with this year’s results.

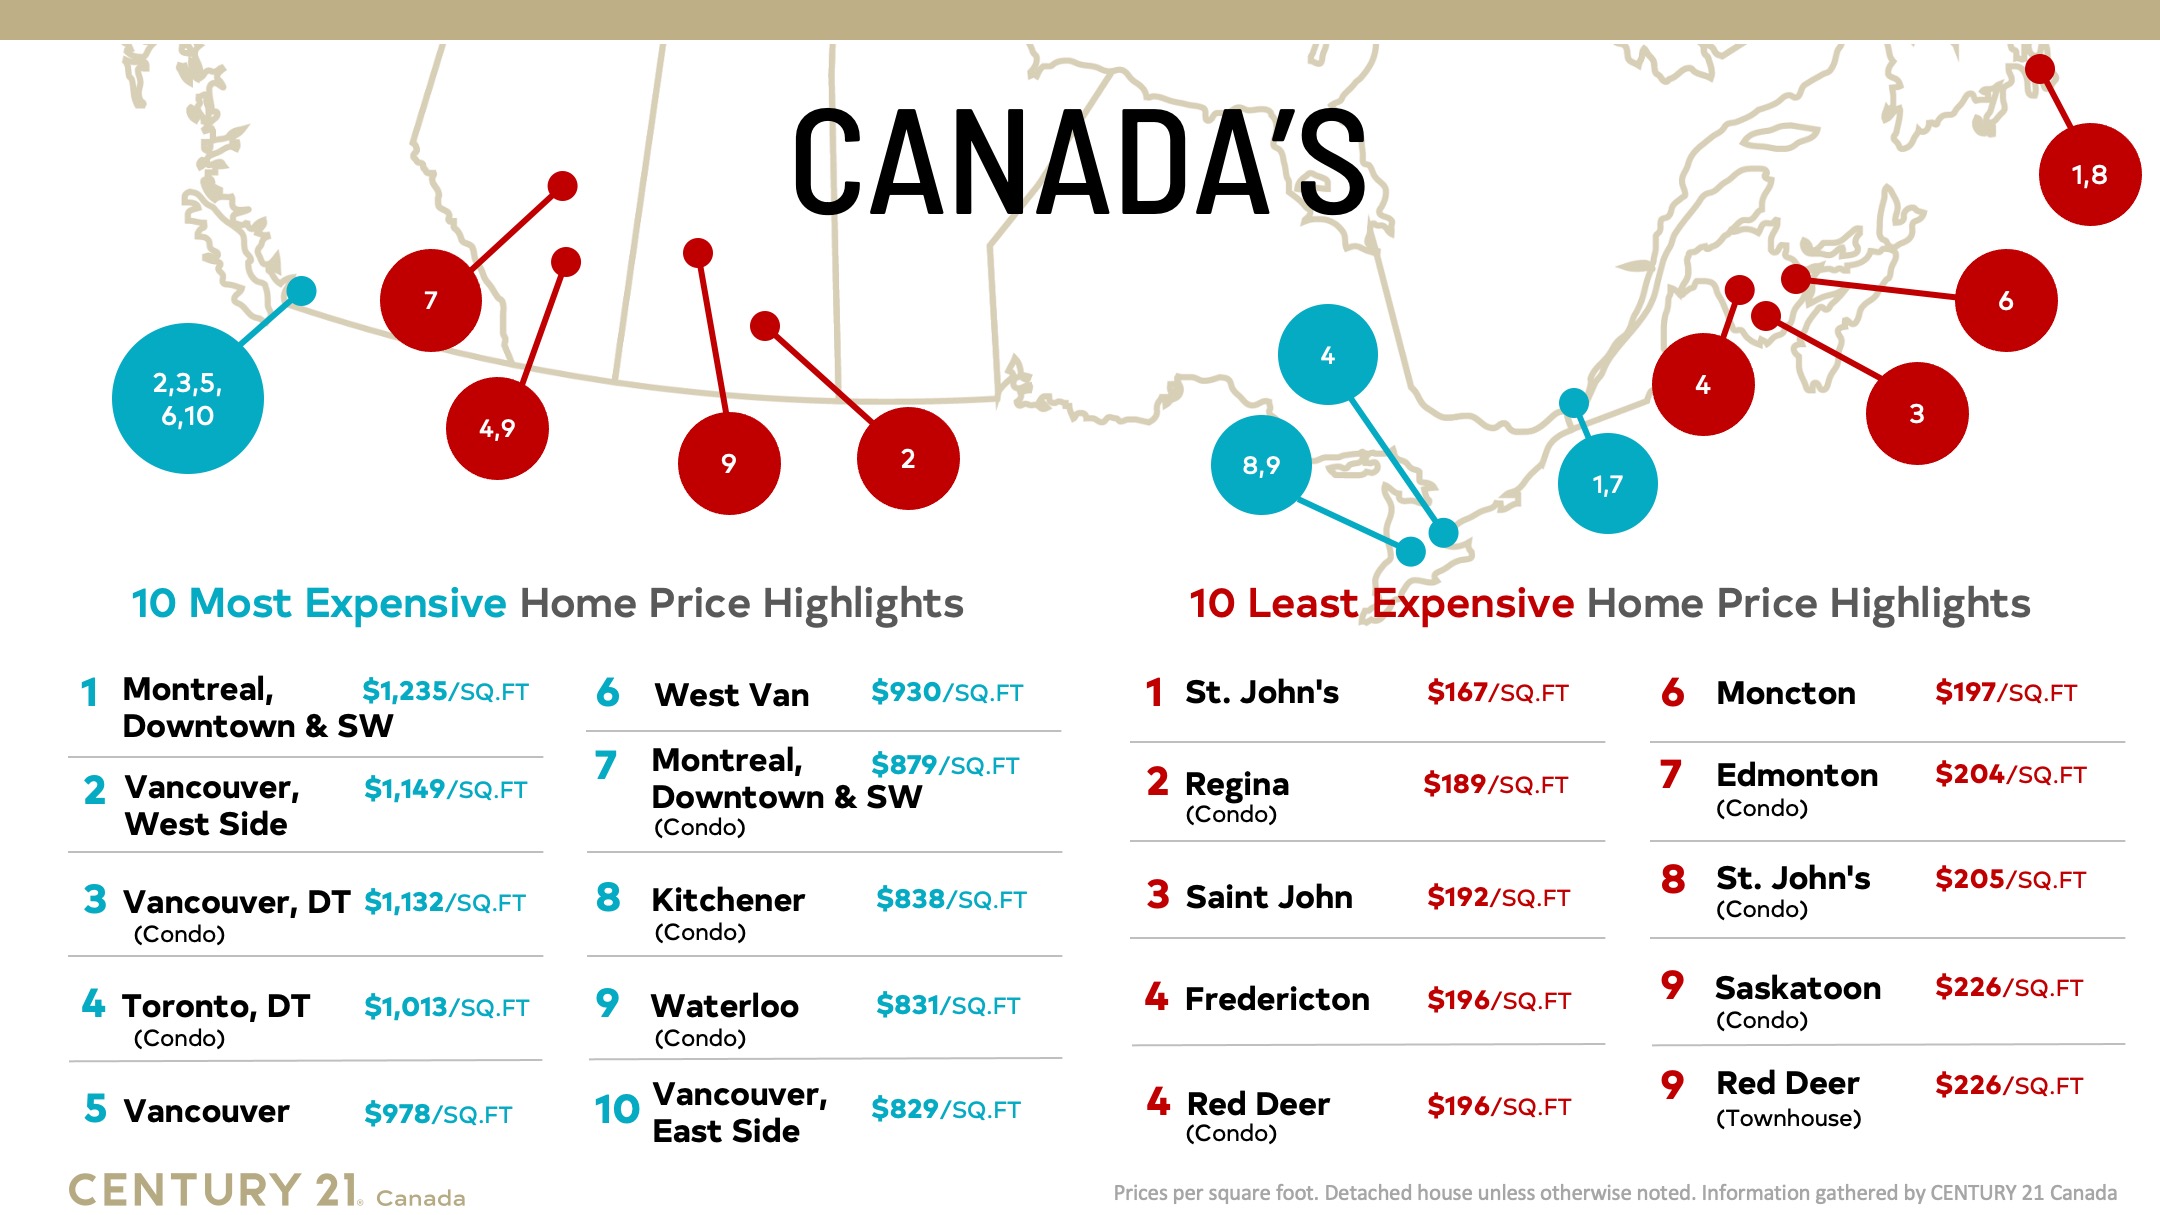
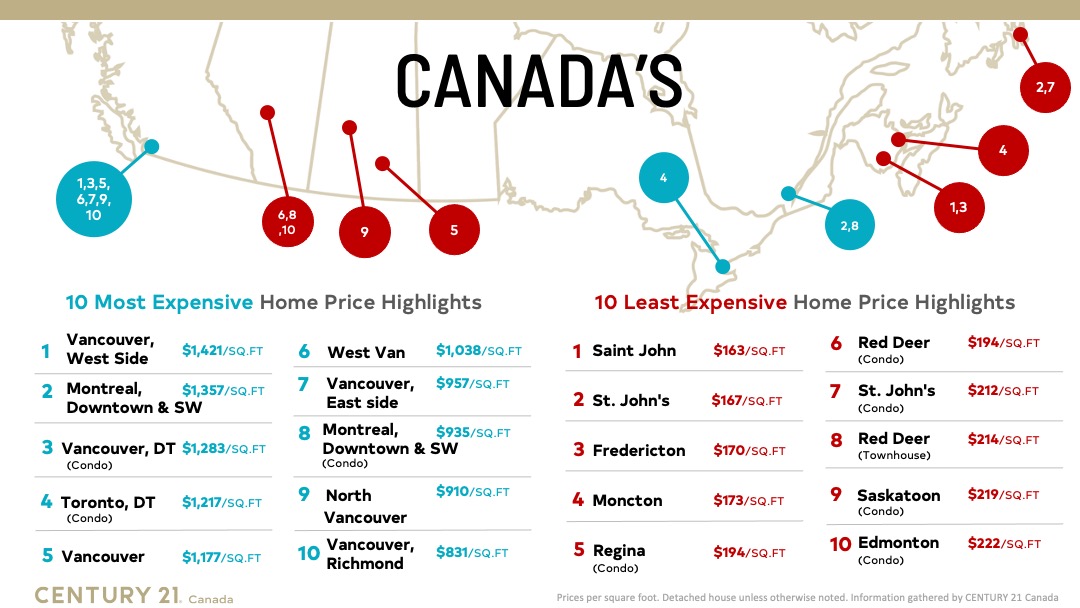
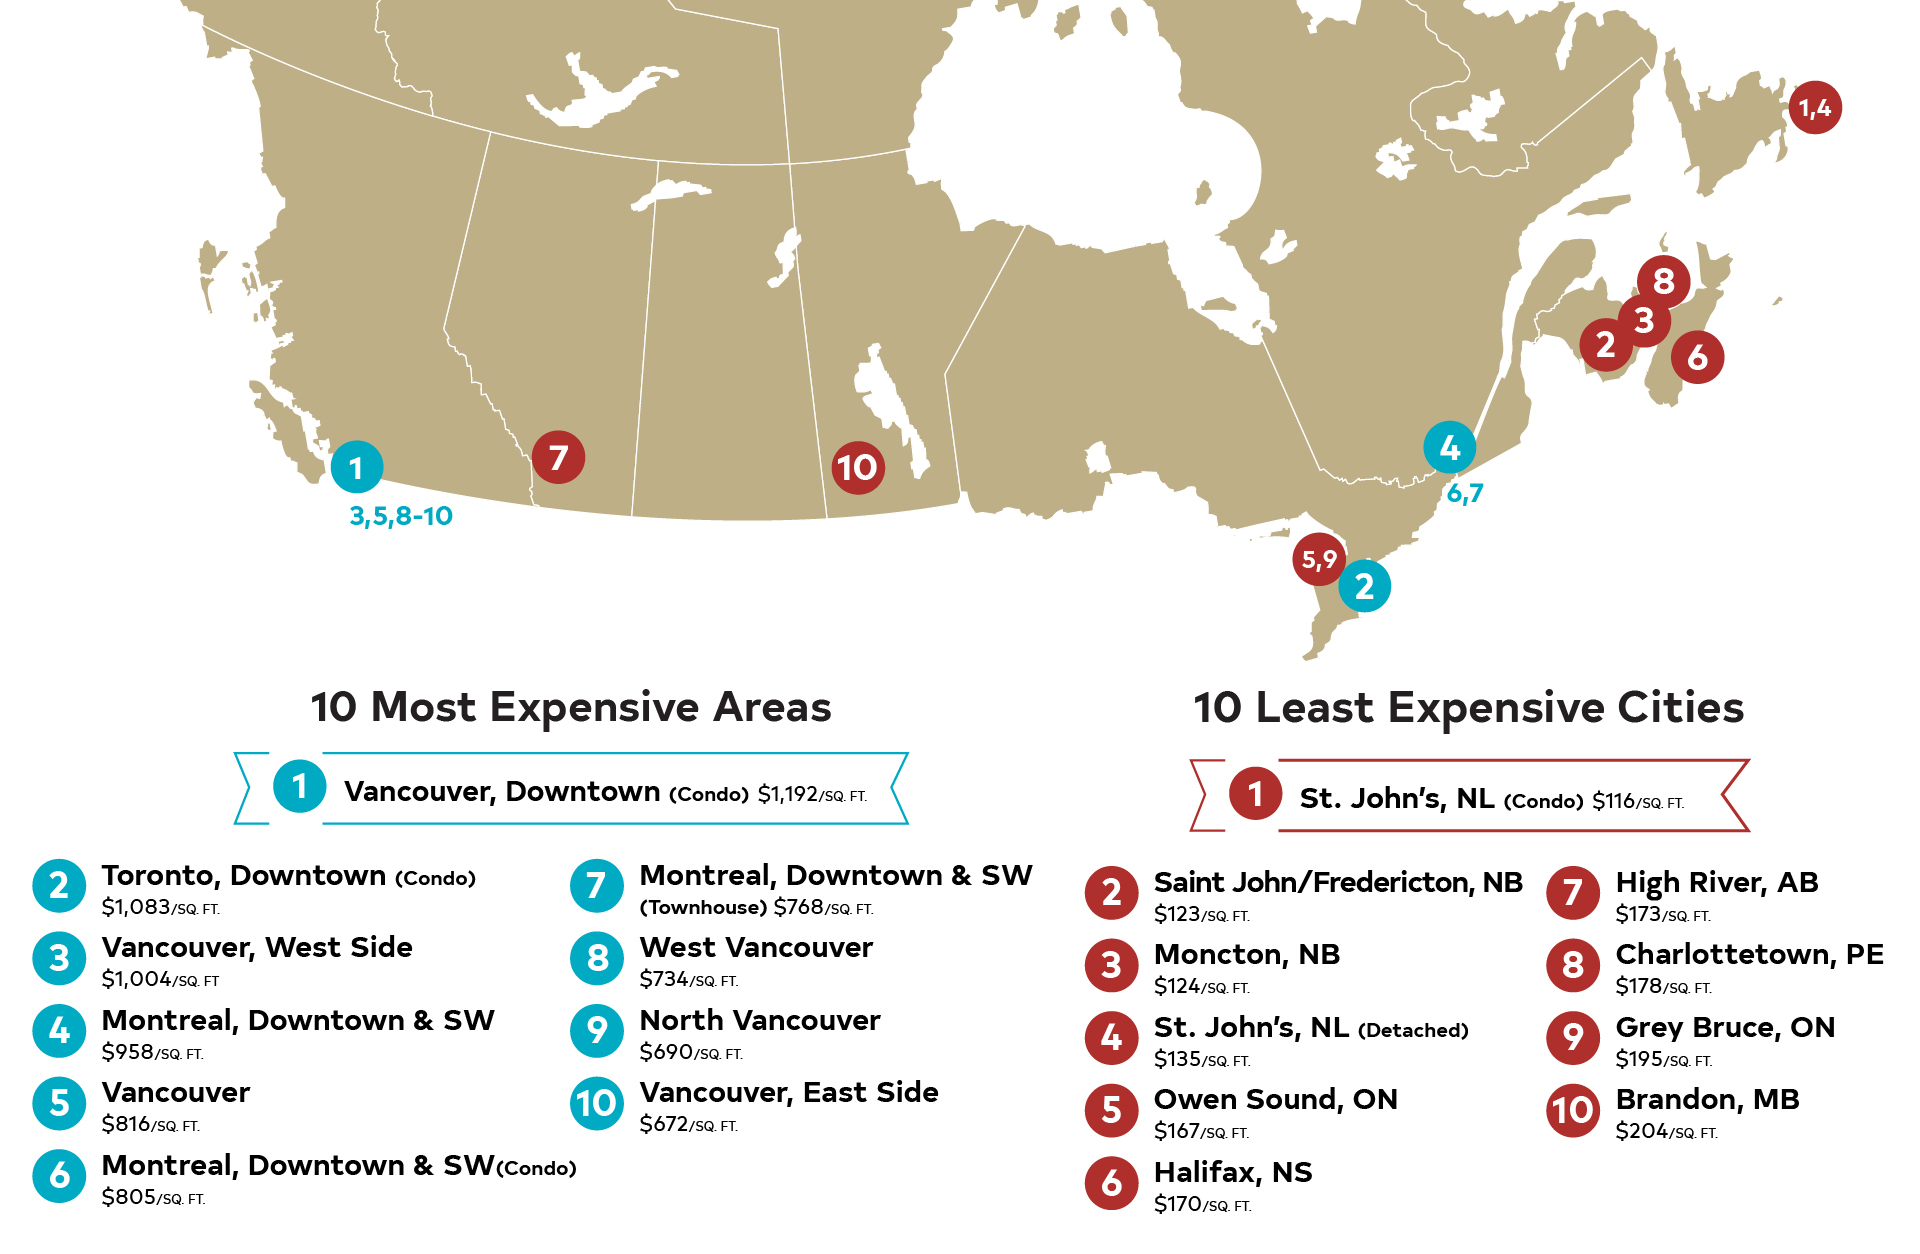
Price Per Square Foot 2022 - 10 Most Expensive Price Per Square Foot 2022 - 10 Least Expensive

See full PPSF study results below:

Price Per Square Foot 2022

ALBERTA

CITY HOUSE TYPE 2018 2019 2020 2021 2022 % Change from 2021
Calgary House $341 $325 $320 $355 $396 11.55%
Calgary Condo $329 $317 $296 $303 $326 7.59%
Edmonton Detached House $288 $272 $268 $284 $297 4.58%
Edmonton Duplex $275 $256 $250 $270 $287 6.30%
Edmonton Condo $231 $220 $206 $217 $222 2.30%
High River Detached House $193 $215 $237 $271 $307 13.28%
High River Condo N/A $241 $173 $176 $223 26.70%
Okotoks Detached House N/A $238 $254 $283 $338 19.43%
Okotoks Condo N/A $254 $211 $219 $251 14.61%
Red Deer Detached House $276 $262 $252 $289 $293 1.38%
Red Deer Townhouse N/A N/A N/A $207 $214 3.38%
Red Deer Condo N/A N/A N/A $186 $194 4.30%
Red Deer Duplex N/A N/A N/A N/A $269 N/A
St. Albert Detached House $287 $271 $269 $289 $322 11.42%
St. Albert Condo $239 $223 $211 $251 $238 -5.18%
St. Albert Duplex $262 $272 $278 $280 $325 16.07%


BRITISH COLUMBIA

CITY HOUSE TYPE 2018 2019 2020 2021 2022 % Change from 2021
Chilliwack Detached House $297 $294 $288 $406 $515 26.85%
Chilliwack Townhouse $267 $249 $250 $318 $425 33.65%
Chilliwack Condo/ Apartment $283 $290 $270 $351 $473 34.76%
Kelowna Detached House $283 $274 $280 $368 $463 25.82%
Kelowna Half Duplex $247 $260 $263 $320 $402 25.63%
Kelowna Townhouse $292 $287 $302 $365 $452 23.84%
Kelowna Apartment $345 $348 $334 $411 $526 27.98%
Vancouver Detached House $856 $769 $816 $975 $1,177 20.72%
Vancouver, Downtown Condo $856 $769 $816 $1,208 $1,283 6.21%
Vancouver, East side Detached House $721 $647 $672 $877 $957 9.12%
Vancouver, West Side Detached House $1,147 $990 $1,004 $1,208 $1,421 17.63%
Burnaby Detached House $599 $551 $579 $688 $795 15.55%
West Van Detached House $899 $738 $734 $971 $1,038 6.90%
Vancouver, Richmond Detached House $677 $598 $608 $722 $831 15.10%
Delta North Detached House $423 $400 $413 $570 $716 25.61%
North Vancouver Detached House $681 $613 $690 $794 $910 14.61%
White Rock/South Surrey Detached House $506 $472 $435 $625 $795 27.20%
Victoria Detached House N/A N/A N/A $558 $592 6.09%
Victoria Townhouse N/A N/A N/A $457 $583 27.57%
Victoria Condo N/A N/A N/A $659 $676 2.58%


ATLANTIC

CITY HOUSE TYPE 2018 2019 2020 2021 2022 % Change from 2021
Charlottetown Detached House $147 $165 $178 $211 $245 16.11%
Fredericton Detached House N/A $99 $123 $147 $170 15.65%
Halifax Detached House $155 $162 $170 $281 $408 45.20%
Halifax Condo $228 $239 $270 $291 $450 54.64%
Moncton Detached House $101 $106 $124 $142 $173 21.83%
Saint John Detached House N/A $111 $123 $134 $163 21.64%
St. John’s Detached House N/A $132 $135 $149 $167 12.08%
St. John’s Condo N/A $174 $116 $182 $212 16.48%


PRAIRIES

CITY HOUSE TYPE 2018 2019 2020 2021 2022 % Change from 2021
Regina Detached House $254 $246 $237 $250 $284 13.60%
Regina Condo $236 $213 $205 $205 $194 -5.37%
Saskatoon Detached House $270 $263 $263 $314 $336 7.01%
Saskatoon Condo $208 $213 $217 $216 $219 1.39%
Winnipeg Detached House $282 $243 $244 $293 $315 7.51%
Winnipeg Condo $261 $220 $223 $234 $254 8.55%
Winnipeg Attached N/A $202 $210 $241 $269 11.62%
Brandon Detached House $248 $246 $248 $271 $276 1.85%
Brandon Condo $196 $204 $204 $203 $243 19.70%


ONTARIO

CITY HOUSE TYPE 2018 2019 2020 2021 2022 % Change from 2021
Barrie Detached House $283 $350 $350 $378 $503 33.07%
Bradford Detached House $286 $345 $358 $410 $580 41.46%
Cambridge Detached House $332 $355 $388 $450 $625 38.89%
Cambridge Duplex $311 $331 $377 $527 $656 24.48%
Cambridge Condo $344 $347 $367 $435 $716 64.60%
Cambridge Townhouse $282 $317 $341 $474 $616 29.96%
Grey Bruce Detached House $175 $182 $195 $357 $455 27.45%
Guelph Detached House $397 $409 $443 $483 $690 42.86%
Guelph Condo $374 $402 $423 $511 $777 52.05%
Guelph Duplex $348 $362 $400 $451 $648 43.68%
Guelph Townhouse $311 $335 $364 $433 $641 48.04%
Hamilton Detached House $362 $378 $406 $532 $553 3.95%
Hamilton Townhouse $257 $350 $343 $453 $538 18.76%
Kitchener Detached House $339 $359 $400 $430 $618 43.72%
Kitchener Semi-Detached N/A $341 $399 $460 $623 35.43%
Kitchener Townhouse N/A $323 $342 $435 $576 32.41%
Kitchener Condo $328 $362 $399 $483 $800 65.63%
London Detached House $191 $237 $250 $362 $466 28.73%
Markham Detached House N/A N/A $485 $557 $685 22.98%
Niagara Falls Bungalow N/A $336 $395 $475 $630 32.63%
Niagara Falls Detached House N/A $275 $300 $390 $531 36.15%
Newmarket Detached House N/A $372 $510 $505 $516 2.18%
Ottawa Detached House $225 $258 $313 $429 $465 8.39%
Ottawa Townhouse N/A N/A N/A $392 $451 15.05%
Ottawa Condo $442 $485 $577 $479 $583 21.71%
Owen Sound Detached House $145 $158 $167 $312 $380 21.79%
Richmond Hill Detached House $445 $465 $522 $520 $665 27.88%
St. Catharines Bungalow $385 $367 $425 $520 $589 13.27%
St. Catharines Detached House $310 $290 $330 $400 $612 53.00%
Toronto, Downtown Condo $903 $994 $1,083 $956 $1,217 27.30%
Vaughn Detached House $434 $503 $548 $612 $695 13.56%
Waterloo Detached House N/A $372 $407 $421 $613 45.61%
Waterloo Semi-detached N/A $357 $399 $439 $648 47.61%
Waterloo Townhouse N/A $324 $344 $408 $641 57.11%
Waterloo Condo N/A $402 $411 $503 $777 54.47%
Windsor Detached House N/A $372 $407 $295 $306 3.73%


QUEBEC

CITY HOUSE TYPE 2018 2019 2020 2021 2022 % Change from 2021
Montreal, Downtown and SW Condo $567 $709 $805 $935 $935 0.00%
Montreal, Downtown and SW Detached House $603 $674 $958 $1,350 $1,357 0.52%


NORTHWEST TERRITORIES

CITY HOUSE TYPE 2018 2019 2020 2021 2022 % Change from 2021
Yellowknife Detached House N/A N/A $277 $312 $315 0.96%
Townhouse N/A N/A $265 $260 $276 6.15%
Manufactured N/A N/A $267 $290 $311 7.24%
Apartment N/A N/A $347 $357 $407 14.01%
Duplex N/A N/A $306 $343 $336 -2.04%


View Pirce Per Square Foot 2021 and Price Per Square Foot 2020


How the information was gathered by CENTURY 21 Canada
CENTURY 21 franchisees were asked to help come up with the average price-per-square-foot in their market. However, calculating a precise number is not an exact science as every office and province tracks statistics slightly differently. As a result, most have used the median price and square footage in their market in sales from January 1 – June 30, 2022. Each franchisee has confirmed that the numbers provided are an accurate representation of the trends market.


For more information please contact:
Peak Communicators
Shawn Hall
Phone: (604) 619-7913
Email: shawn@apogeepr.ca

Consumer News 11 August 2021

National Home Prices Spike in 2021 with Atlantic Canada Seeing Unprecedented Increases

Vancouver (August 11, 2021) – House prices across Canada have grown significantly over the past year, particularly in Atlantic Canada and more recreational locations, despite the COVID-19 pandemic. The fifth annual Price per Square Foot survey is being released by CENTURY 21 Canada and shows that real estate continues to be an excellent investment for Canadians. While real estate is most often dependent on the local market, the past year has seen widespread increases in prices from coast to coast.

In its annual, nationwide study, CENTURY 21 Canada compared the price per square foot of properties sold between January 1 and June 30 this year, compared to the same period last year.

“Looking at the prices across Canada, there isn’t one region that hasn’t seen price growth in the past year,” says Brian Rushton, Executive Vice-President of CENTURY 21 Canada. “When the pandemic began in 2020, the market became unchartered territory. But because of low inventory and high demand from buyers looking for a larger space, prices have steadily climbed for the past year, particularly detached homes. Over the past couple of months, that growth has slowed and condo prices have started increasing again– it’s still a seller’s market from Victoria to St. John’s.”

When COVID-19 began to take hold in spring 2020, the belief was that the market would struggle. However, after an initial dip, pent up demand for housing, particularly detached homes, increased prices throughout last fall and earlier this year, in part due to a lack of supply. As evidenced in the data, prices in central major metros have been softer than those in traditionally less expensive markets like Owen Sound and Atlantic Canada.

Rushton says prices have moderated over the past couple of months. “This is typical of what we see through the summer months, but all signs are pointing to another busy fall as inventory across the country continues to be low with plenty of buyers waiting to make a move as soon as they can.”


Regional highlights:

Price Per Square Foot Survey 2021 - Atlantic Canada 

Atlantic

Atlantic Canada has long been seen as the most affordable region in Canada for housing. But over the past year, prices have consistently increased with work from home becoming a viable option for many workers. Halifax has seen the biggest increase in prices, but Charlottetown, Fredericton, Moncton, and St. John’s are all seeing double-digit increases.

“Because we are still affordable, people are flocking here,” says Paul Burns, Manager at CENTURY 21 A&T Countryside Realty. “Between people from Ontario finding that they can afford a home in Atlantic Canada, newcomers increasingly locating here, and locals who want to stay, this region is seeing prices we’ve never seen before.”


Price Per Square Foot Survey 2021 - British Columbia

British Columbia

BC real estate is the most expensive in the country and remains so again this year. Prices in the outskirts of the city saw the largest increase with Chilliwack prices up over 40 percent to $406 per square foot, Delta up 38 percent to $50 per square foot and White Rock/South Surrey up 44 percent to $625 per square foot. Kelowna also saw solid increases with prices up anywhere between 20 and 30 percent, depending on what home type the consumer is choosing.


Price Per Square Foot Survey 2021 - Quebec

Quebec

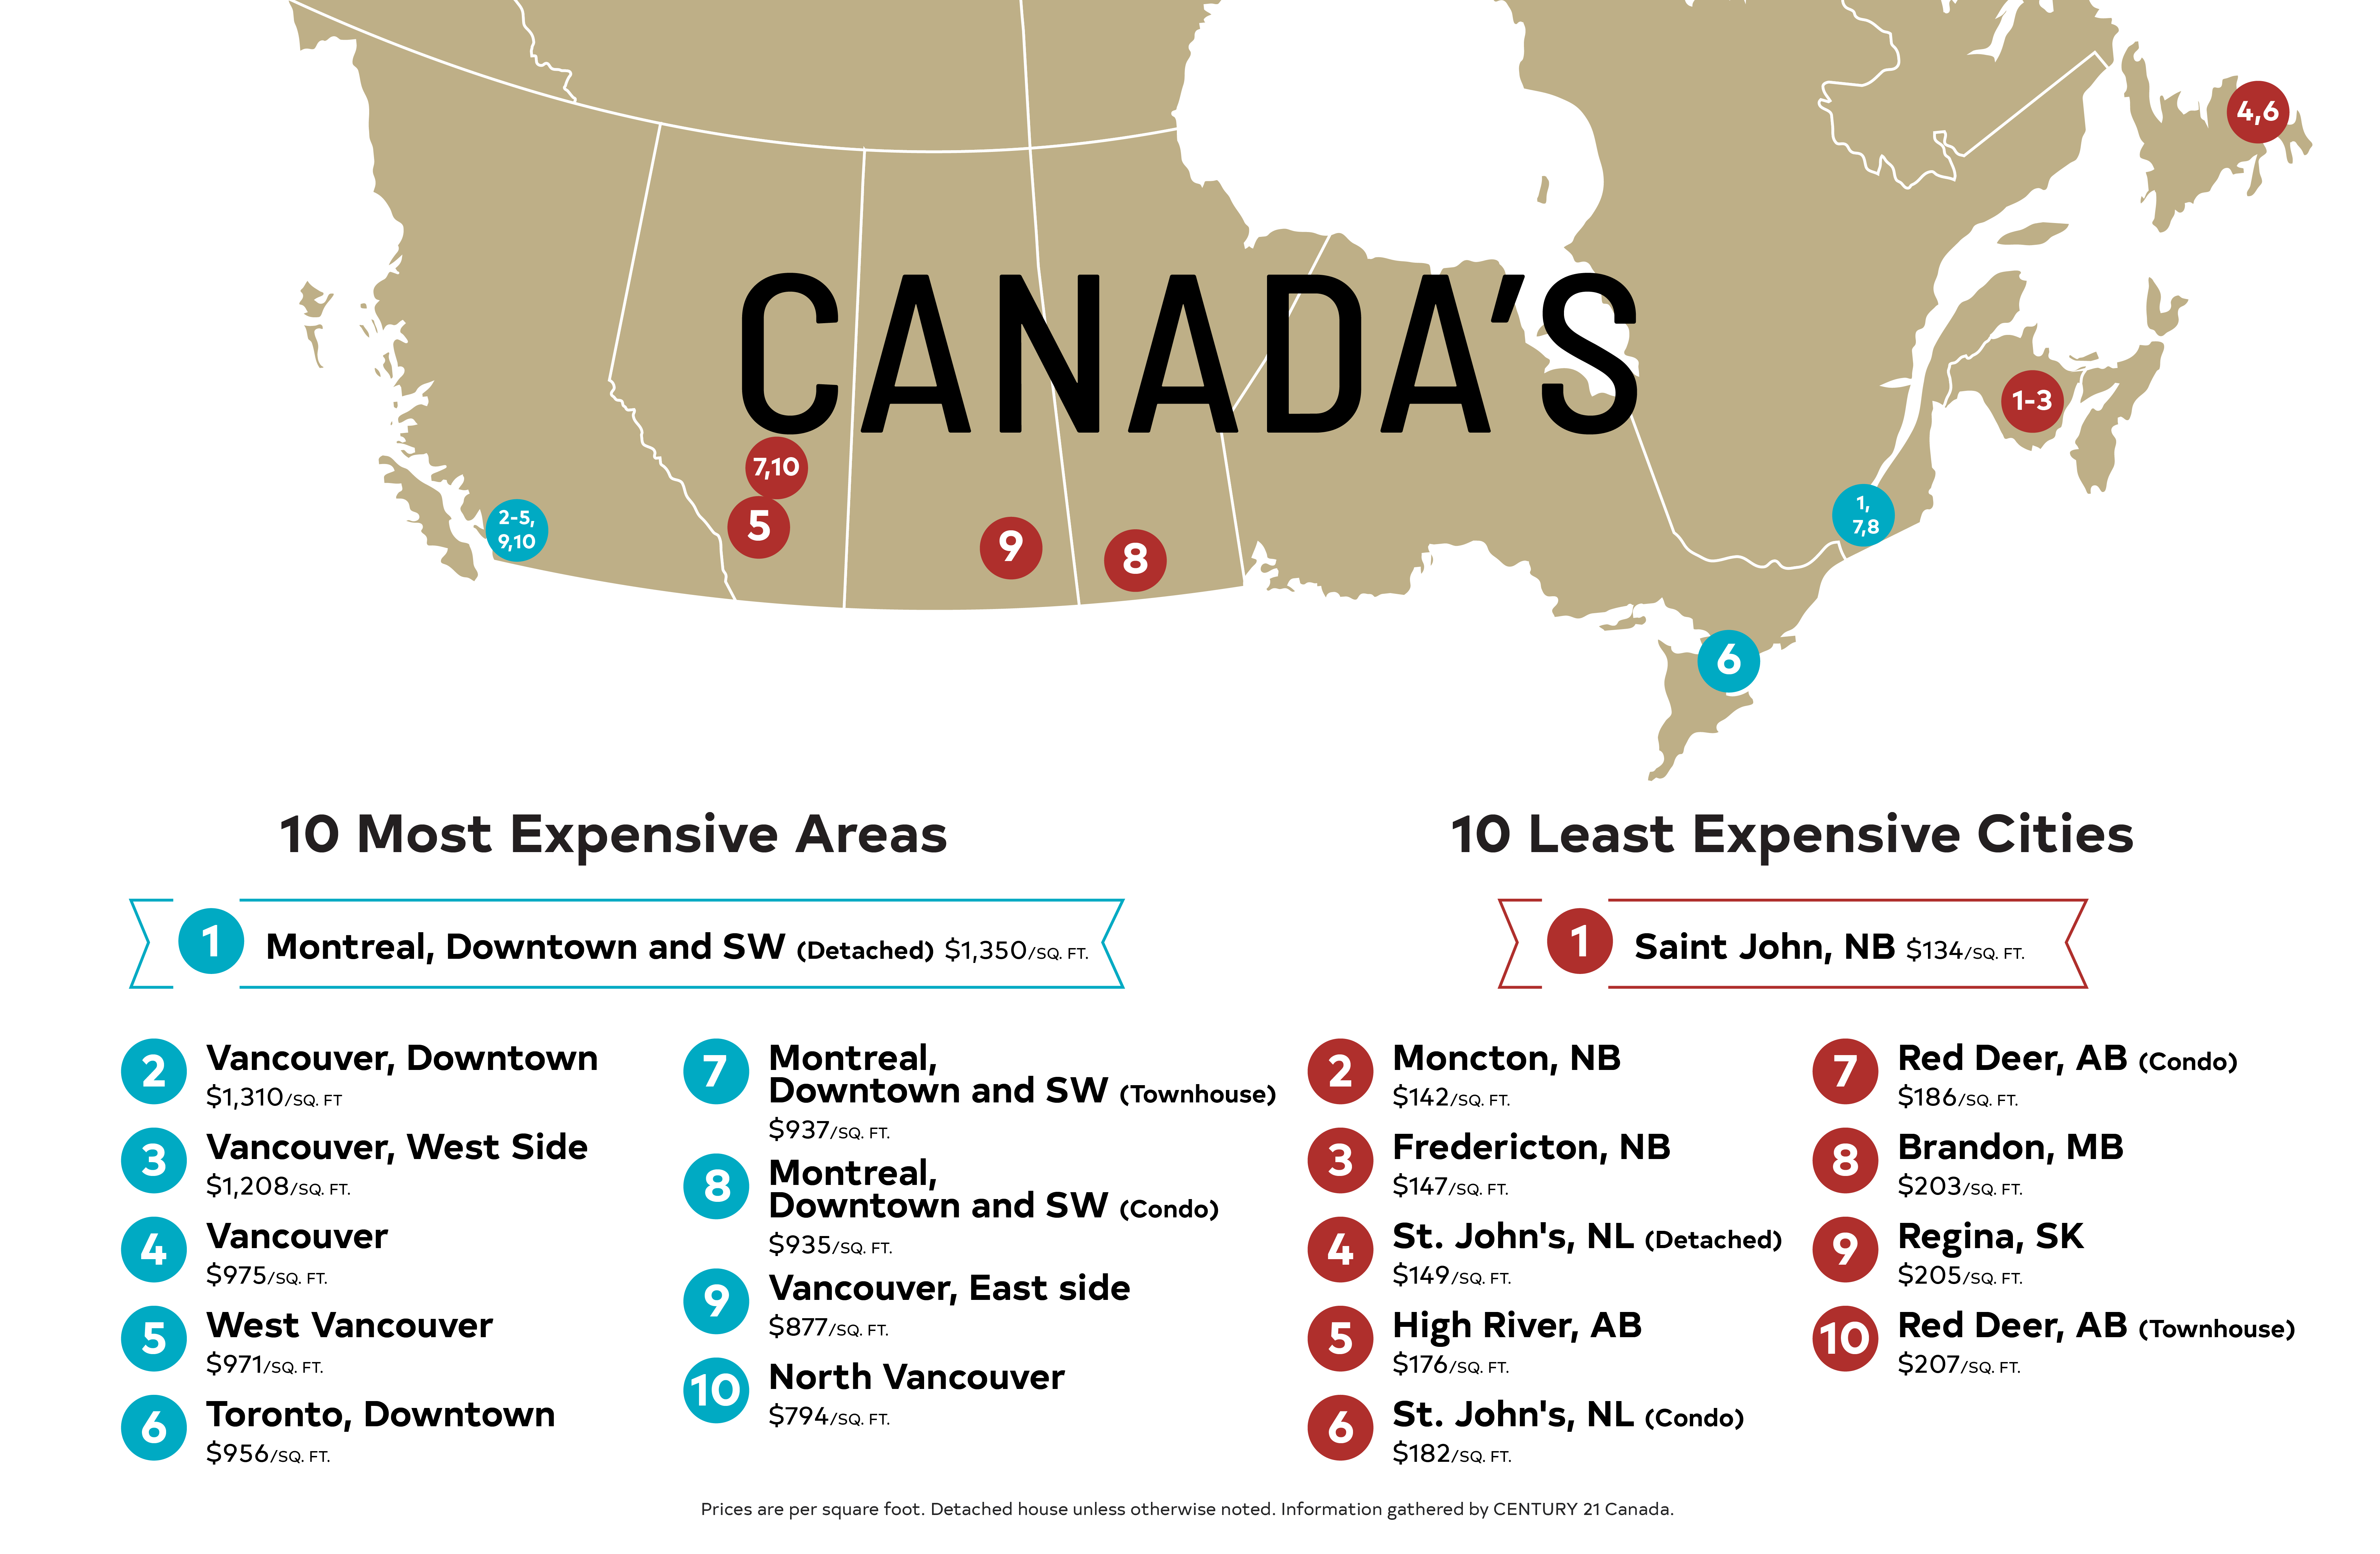
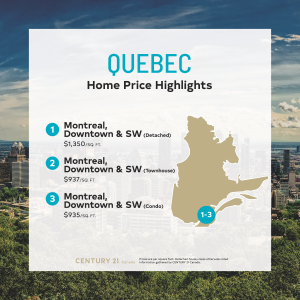
Real estate in Quebec has been strong for several years now. Yet again, prices increased significantly since last year, with the price of a detached house in Montreal’s downtown and southwest rising 41 percent to $1350 per square foot while townhouses increased 22 percent to $937 per square foot and condos 16 percent to $935. Over the past five years prices in Montreal have essentially caught up to those in Vancouver and Toronto. “Montreal saw affordable prices for many years, but people saw the value in this city and the cost of a home is now on par with other major cities in the country,” says Mohamad Al-Hajj, owner of CENTURY 21 Immo-Plus in Montreal.


Price Per Square Foot Survey 2021 - Ontario

Ontario

2019 to 2020 saw modest growth in Ontario, and the past year has seen even bigger increases. Most notably, the prices in Owen Sound and Grey Bruce are up more than 80 percent. “Demand has been off the charts,” says Mike Seiler, owner of CENTURY 21 In Studio Realty. “Our clients are moving up from Toronto now that they can work from home. People are also realizing how much more space you can get once you get out of the metro area.”

Suburbs have all seen double-digit increases in prices, with the highest in those communities that are just a little outside a regular commute. “Now that people are commuting a few times a week rather than every day, they’re willing to be a bit further from their jobs in order to secure a bigger home at a more affordable price,” says Eryn Richardson of CENTURY 21 Heritage Group.

Prices in downtown Toronto condos were actually slightly down for the first six months of the year, but are coming back strong. 2021 started with lower prices than we saw in the initial pandemic, but have increased as the year went on. Ottawa condos were also down year over year but, they too are rebounding as 2021 continues.


Price Per Square Foot Survey 2021 - Prairies

Prairies

Prairie house prices have seen some growth, although they are the slowest growing areas of the province. Saskatoon homes are up nearly twenty percent to $314 per square foot although condo prices remained flat and Regina properties only saw minor increases in prices. Winnipeg saw the biggest gains with homes up as much as twenty percent to $293 per square foot for a house and $241 per square foot for a condo.

Price Per Square Foot Survey 2021 - Alberta

Alberta

Many markets in Alberta saw decreases in previous surveys but are up anywhere from three to fifteen percent depending on the city and home type. Like many markets around the country, detached homes have seen the largest increases compared to other home types. Red Deer and High River saw the highest house increases, with prices at $289 per square foot and $271 respectively. Condos in St. Albert are the other standout in Alberta real estate with a nearly 19 per cent increase to $251 per square foot, which is still among the most affordable in the country.


Price Per Square Foot Survey 2021 - Northwest Territories

Even Yellowknife properties have seen an increase in prices. Both houses and duplexes have seen double digit increases while other house types have seen more subtle changes.

“This is the fifth consecutive year we have done this survey and, while previous years showed that real estate is a local story, we have seen widespread increases across the country this year,” says Mr. Rushton. “Real estate is security—both emotional and physical—and after the pandemic people continue to want to invest in the places they want to spend the most time.”

CENTURY 21 Canada’s annual survey of data on the price per square foot (PPSF) of properties gathers and compares sales data from its franchises across Canada from January 1 to June 30 of each year. By looking at the price per square foot at the same time each year the firm is able to get a good idea of how prices have changed over time for similar properties. This year’s survey compares 2020 prices with this year’s results.

Price Per Square Foot Survey 2021 - Top Most Expensive. Price Per Square Foot Survey 2021 - Top Least Expensive


See full PPSF study results below:

ATLANTIC

CITY
HOUSE TYPE
2020 PPSF
2021 PPSF
% CHANGE 2020-2021
Halifax Condo $223 $291 30.49%
Halifax Detached House $225 $281 24.89%
Charlottetown Detached House $178 $211 18.54%
St. John’s Condo $162 $182 12.35%
St. John’s Detached House $135 $149 10.01%
Fredericton Detached House $123 $147 19.62%
Moncton Detached House $124 $142 14.78%
Saint John Detached House $123 $134 8.63%

BRITISH COLUMBIA

CITY
HOUSE TYPE
2020 PPSF
2021 PPSF
% CHANGE 2020-2021
Vancouver, Downtown Condo $1,192 $1,310 9.90%
Vancouver, West Side Detached House $1,004 $1,208 20.30%
Vancouver Detached House $816 $975 19.57%
West Van Detached House $734 $971 32.25%
Vancouver, East side Detached House $672 $877 30.48%
North Vancouver Detached House $690 $794 14.97%
Vancouver, Richmond Detached House $608 $722 18.69%
Burnaby Detached House $579 $688 18.76%
Victoria Condo $615 $659 7.15%
White Rock/South Surrey Detached House $435 $625 43.64%
Delta North Detached House $413 $570 37.88%
Victoria Detached House $488 $558 14.34%
Victoria Townhouse $418 $457 9.33%
Kelowna Apartment $334 $411 22.95%
Chilliwack Detached House $288 $406 40.72%
Kelowna Detached House $280 $368 31.41%
Kelowna Townhouse $302 $365 20.59%
Chilliwack Condo/ Apartment $270 $351 29.84%
Kelowna Half Duplex $263 $320 21.54%
Chilliwack Townhouse $250 $318 27.00%

QUEBEC

CITY
HOUSE TYPE
2020 PPSF
2021 PPSF
% CHANGE 2020-2021
Montreal, Downtown and SW Detached House $958 $1,350 40.92%
Montreal, Downtown and SW Townhouse $768 $937 22.01%
Montreal, Downtown and SW Condo $805 $935 16.15%


ONTARIO

CITY
HOUSE TYPE
2020 PPSF
2021 PPSF
% CHANGE 2020-2021
Toronto, Downtown Condo $1,033 $956 -7.45%
Vaughn Detached House $548 $612 11.75%
Markham Detached House $485 $557 14.96%
Hamilton Detached House $406 $532 30.94%
Cambridge Duplex $377 $527 39.79%
Richmond Hill Detached House $522 $520 -0.43%
St. Catharines Bungalow $425 $520 22.35%
Guelph Condo $423 $511 20.80%
Newmarket Detached House $510 $505 -1.04%
Waterloo Condo $411 $503 22.38%
Guelph Detached House $443 $483 9.03%
Kitchener Condo $399 $483 21.05%
Ottawa Condo $577 $479 -16.98%
Niagara Falls Bungalow $395 $475 20.25%
Cambridge Townhouse $341 $474 39.00%
Kitchener Semi-Detached $399 $460 15.29%
Hamilton Townhouse $343 $453 32.13%
Hamilton Apartment/ Condo $370 $453 22.39%
Guelph Duplex $400 $451 12.75%
Cambridge Detached House $388 $450 15.98%
Waterloo Semi-detached $399 $439 10.03%
Cambridge Condo $367 $435 18.53%
Kitchener Townhouse $342 $435 27.19%
Guelph Townhouse $364 $433 18.96%
Kitchener Detached House $400 $430 7.50%
Ottawa Detached House $313 $429 37.06%
Waterloo Detached House $407 $421 3.44%
Bradford Detached House $358 $410 14.45%
Waterloo Townhouse $344 $408 18.60%
St. Catharines Detached House $330 $400 21.21%
Ottawa Townhouse $392 N/A
Niagara Falls Detached House $300 $390 30.00%
Barrie Detached House $350 $378 8.00%
London Detached House $250 $362 44.80%
Grey Bruce Detached House $195 $357 82.87%
Owen Sound Detached House $167 $312 86.77%
Windsor Detached House $210 $295 40.48%

PRAIRIES

CITY
HOUSE TYPE
2020 PPSF
2021 PPSF
% CHANGE 2020-2021
Saskatoon Detached House $263 $314 19.39%
Winnipeg Detached House $244 $293 20.18%
Brandon Detached House $248 $271 9.01%
Regina Detached House $237 $250 5.35%
Winnipeg Attached $210 $241 14.53%
Winnipeg Condo $223 $234 4.79%
Saskatoon Condo $217 $216 -0.58%
Regina Condo $205 $205 0.18%
Brandon Condo $204 $203 -0.30%

ALBERTA

CITY
HOUSE TYPE
2020 PPSF
2021 PPSF
% CHANGE 2020-2021
Calgary House $320 $355 10.94%
Calgary Condo $296 $303 2.36%
St. Albert Detached House $269 $289 7.56%
Red Deer Detached House $252 $289 14.65%
Edmonton Detached House $268 $284 6.17%
Okotoks Detached House $254 $283 11.44%
St. Albert Duplex $278 $280 0.89%
High River Detached House $237 $271 14.34%
Edmonton Duplex $250 $270 7.70%
St. Albert Condo $211 $251 18.92%
Okotoks Condo $211 $219 3.57%
Edmonton Condo $206 $217 5.19%
Red Deer Townhouse $207 N/A
Red Deer Condo $186 N/A
High River Condo $173 $176 1.80%

NORTHWEST TERRITORIES

CITY
HOUSE TYPE
2020 PPSF
2021 PPSF
% CHANGE 2020-2021
Yellowknife Apartment $347.00 $357.00 2.88%
Yellowknife Duplex $306.00 $343.00 12.09%
Yellowknife Detached House $277.00 $312.00 12.64%
Yellowknife Manufactured $267.00 $290.00 8.61%
Yellowknife Townhouse $265.00 $260.00 -1.89%


For more information please contact:

Shawn Hall, Peak Communicators
(604) 619-7913
shawn@peakco.com

Leigh Kjekstad, Director of Brand Engagement, CENTURY 21 Canada
604-606-2139
Leigh.Kjekstad@century21.ca


Read more:
Consumer News 24 August 2020

Price Per Square Foot Survey 2020

National real estate survey finds home prices holding steady, sales coming back after decline early in pandemic

Vancouver (August 24, 2020) – An annual report out from CENTURY 21 Canada today reveals house prices across Canada are maintaining their strength, while the number of sales is coming back after a decline earlier in the spring due to the COVID-19 pandemic. While the local stories vary across the country, the common theme is of house prices seeing modest changes per square foot over the same period last year. One exception is Montreal, which has seen prices increase dramatically since 2019 – though downtown prices still remain lower than those in Vancouver and Toronto.

In its annual, nationwide study, CENTURY 21 Canada compared the price per square foot of properties sold between January 1 and June 30 this year, compared to the same period last year.

“When the pandemic took hold in Canada in mid-March, there was a lot of uncertainty about what would happen to real estate sales during the typically busy spring market,” says Brian Rushton, Executive Vice-President of CENTURY 21 Canada. “What we have seen is that after a dip in the number of sales early in the pandemic, the pace of sales has returned to near-normal levels as real estate agents and companies innovated new ways of doing things. The real estate industry has proved resilient through the past several months. And even further, prices have held steady as well.”

As it has in many sectors of Canada’s economy, COVID-19 has prompted innovations in how real estate operations, with the adoption of technologies allowing more physical distancing and reducing contact. CENTURY 21 Canada has made additional tools available to sales representatives in order to facilitate the change. Virtual tours are now very popular so that a seller does not have strangers or large numbers of people in their homes. The company encourages all agents to host online open houses through Facebook Live. CENTURY 21 Canada has also recently partnered with an international company, EyeSpy360, which allows a virtual home tour that can be done as a walk-through and presented to a client via email or a live presentation.

Regional highlights:

Quebec

The strongest real estate market in Canada right now is Montreal, with prices increasing significantly since last year, particularly in the downtown detached house and townhouse markets. The price of a detached house in Montreal’s downtown and southwest rose 42.14 per cent to $958 per square foot, while townhouses came up 44 per cent to $768 and condos 13.55 per cent to $805. While prices in Montreal remain lower than those in Vancouver and Toronto they are catching up as prices in those other centres saw more modest increases or even declines. “Even though real estate in Quebec was not considered an essential service, we have seen strong demand and a jump in prices in 2020,” says Mohamad Al-Hajj, owner of CENTURY 21 Immo-Plus in Montreal.

Price Per Square Foot Survey 2020_Ontario

Ontario

Prices have continued to increase in communities across Ontario, particularly just outside the GTA. Newmarket has seen the biggest increase since last year with prices for single family detached houses climbing 37.29 percent, while in Kitchener semi-detached homes increased 17 percent to $399 per square foot. Ottawa is also proving to be strong with increases of about 20 per cent – houses increasing to $313 per square foot and condos to $577 per square foot. Downtown Toronto condos increased 8.9 per cent per square foot to $1,083 – breaking the $1,000 mark. Downtown Toronto condos remain the second most expensive in Canada, after Vancouver condos. Hamilton, meanwhile, saw modest decreases in price per square foot. Rushton says, “With a work from home option more realistic for some people, they’re finding they can get a larger home if they move a bit further from Toronto. Even if their commute is a little longer they’re traveling to an office less often, which makes it more tolerable.”

Price Per Square Foot Survey 2020_British Columbia

British Columbia

BC property prices often receive attention from across the country, but in 2020 saw only minor changes, especially compared to increases seen in previous years. Downtown Vancouver condos decreased modestly in price per square foot (down 3.97 per cent to $1,192), but remained the most expensive properties in Canada – though prices for condos in Toronto and Montreal are catching up. Prices of detached houses in City of Vancouver neighbourhoods increased modestly, as did homes in  North Vancouver (up 4.75 percent to $690 per square foot), Burnaby (up 5.2 per cent to $579 per square foot), and Richmond (up 1.73 per cent to $608). Both Chilliwack and White Rock/South Surrey saw modest declines, dropping 6.78 percent and 7.81 percent respectively.

Price Per Square Foot Survey 2020_Prairies

Prairies

Prairie house prices continue to be the most affordable in Canada other than those in the Atlantic provinces, and have generally remained flat over the past year. Rural Alberta was an exception, with a soft condo market in some communities. Condos in High River, Alberta have dropped more than 28 percent to $173 per square foot, though in the same community prices for a detached house rose 10.4 per cent to $237 per square foot. Okotoks and St. Albert saw similar trends, though not as marked. In In Edmonton, houses and condos have dropped modestly Calgary house prices have dropped 1.54 per cent to $320 per square foot, while condos have dropped 6.62 per cent. “This is an area that has long relied on the oil and gas industry,” says George Bamber, Owner of CENTURY 21 Bamber Realty in Calgary. “Continued uncertainty in that sector is keeping prices from growing.”

Prices for both condos and detached houses declined almost four per cent in Regina, and were flat in Saskatoon, Brandon, and Winnipeg.

Price Per Square Foot Survey 2020_Atlantic Canada

Atlantic

Most of Atlantic Canada saw strong price increases over the last year, though the region remains the most affordable place to purchase real estate in Canada. St. John’s is the exception, where weak industry forced prices for condos down 33.4 per cent to $116 per square foot, while house prices remained flat (up 1.33 per cent to $135). However, Fredericton house prices shot up 24.56 per cent to $123, while Moncton houses rose 19.98 per cent to $124. Condo prices in Halifax remained the highest in the region, up 12.97 per cent to $270 per square foot – on par with a home in Edmonton but lower than those in Calgary. “We’ve seen great interest in home purchases in our area in 2020. I think people see the value in homes here and are looking for a place to put down roots. This region provides affordable housing and a great lifestyle,” says Paul Burns, Manager at CENTURY 21 A&T Countryside Realty.

This is the fourth consecutive year CENTURY 21 Canada has gathered and released this report of local prices per square foot.

“As we are in our fourth year of gathering this data, we continue to see that real estate is not a national picture, it’s really what’s happening in your local community,” says Mr. Rushton. “No matter where in Canada you live buying a home is a great investment, especially if you’re making a long-term purchase.”

CENTURY 21 Canada’s annual survey of data on the price per square foot (PPSF) of properties gathers and compares sales data from its franchises across Canada from January 1 to June 30 of each year. By looking at the price per square foot at the same time each year the firm is able to get a good idea of how prices have changed over time for similar properties. This year’s survey compares 2019 prices with this year’s results, while also providing available 2017 and 2018 data.

For more information please contact:
Leigh Kjekstad | Director of Brand Engagement
Phone: (604) 606-2139
Email: Leigh.Kjekstad@century21.ca


British Columbia

CITY
HOUSE TYPE
2017 PPSF
2018 PPSF
2019 PPSF
2020 PPSF
% CHANGE 2019-2020
Vancouver, Downtown Condo $963 $1,345 $1,241 $1,192 -3.97%
Vancouver, West Side Detached House $1,210 $1,147 $990 $1,004 1.47%
Vancouver Detached House $890 $856 $769 $816 6.09%
West Van Detached House $817 $899 $738 $734 -0.45%
North Vancouver Detached House $626 $681 $613 $690 12.58%
Vancouver, East side Detached House $719 $721 $647 $672 3.84%
Victoria Condo $615 N/A
Vancouver, Richmond Detached House $614 $677 $598 $608 1.73%
Burnaby Detached House $588 $599 $551 $579 5.20%
Victoria Detached House $458 $509 $442 $488 10.41%
Victoria- Western Communities Condo $460 N/A
White Rock/South Surrey Detached House $554 $506 $472 $435 -7.81%
Victoria Townhouse $418 N/A
Delta North Detached House $370 $423 $400 $413 3.21%
Victoria- Western Communities Detached House $346 N/A
Victoria- Western Communities Townhouse $346 N/A
Kelowna Apartment $314 $345 $348 $334 -3.84%
Kelowna Townhouse $268 $292 $287 $302 5.45%
Chilliwack Detached House $259 $297 $294 $288 -1.99%
Kelowna Detached House $263 $283 $274 $280 2.35%
Chilliwack Condo/ Apartment $198 $283 $290 $270 -6.78%
Kelowna Half Duplex $232 $247 $260 $263 1.41%
Chilliwack Townhouse $208 $267 $249 $250 0.40%

Alberta

CITY
HOUSE TYPE
2017 PPSF
2018 PPSF
2019 PPSF
2020 PPSF
% CHANGE 2019-2020
Calgary House $341 $325 $320 -1.54%
Calgary Condo $329 $317 $296 -6.62%
St. Albert Duplex $274 $262 $272 $278 2.23%
St. Albert Detached House $290 $287 $271 $269 -0.62%
Edmonton Detached House $289 $288 $272 $268 -1.37%
Okotoks Detached House $238 $254 6.67%
Red Deer Detached House $282 $276 $262 $252 -3.96%
Edmonton Duplex $261 $275 $256 $250 -2.35%
High River Detached House $202 $193 $215 $237 10.40%
Okotoks Condo $254 $211 -16.65%
St. Albert Condo $247 $239 $223 $211 -5.57%
Edmonton Condo $261 $231 $220 $206 -6.00%
High River Condo $241 $173 -28.26%

Prairies

CITY
HOUSE TYPE
2017 PPSF
2018 PPSF
2019 PPSF
2020 PPSF
% CHANGE 2019-2020
Saskatoon Detached House $296 $270 $263 $263 0.00%
Brandon Detached House $248 $248 $246 $248 0.86%
Winnipeg Detached House $267 $282 $243 $244 0.33%
Regina Detached House $263 $254 $246 $237 -3.74%
Winnipeg Condo $261 $220 $223 1.48%
Saskatoon Condo $231 $208 $213 $217 2.00%
Winnipeg Attached $202 $210 4.19%
Regina Condo $246 $236 $213 $205 -3.86%
Brandon Condo $201 $196 $204 $204 -0.11%

Ontario

CITY
HOUSE TYPE
2017 PPSF
2018 PPSF
2019 PPSF
2020 PPSF
% CHANGE 2019-2020
Toronto, Downtown Condo $819 $903 $994 $1,083 8.91%
Ottawa Condo $442 $485 $577 18.97%
Vaughn Detached House $434 $503 $548 8.91%
Richmond Hill Detached House $585 $445 $465 $522 12.29%
Newmarket Detached House $372 $510 37.29%
Markham Detached House $485 N/A
Guelph Detached House $380 $397 $409 $443 8.31%
St. Catharines Bungalow $385 $367 $425 15.80%
Guelph Condo $374 $402 $423 5.22%
Waterloo Condo $402 $411 2.24%
Waterloo Detached House $372 $407 9.41%
Hamilton Detached House $362 $378 $406 7.40%
Guelph Duplex $330 $348 $362 $400 10.50%
Kitchener Detached House $320 $339 $359 $400 11.42%
Kitchener Semi-Detached $341 $399 17.01%
Kitchener Condo $328 $362 $399 10.22%
Waterloo Semi-detached $357 $399 11.76%
Niagara Falls Bungalow $336 $395 17.56%
Cambridge Detached House $325 $332 $355 $388 9.30%
Cambridge Duplex $300 $311 $331 $377 13.90%
Hamilton Apartment/ Condo $234 $376 $370 -1.72%
Cambridge Condo $344 $347 $367 5.76%
Guelph Townhouse $311 $335 $364 8.66%
Bradford Detached House $286 $345 $358 3.93%
Barrie Detached House $283 $350 $350 0.00%
Waterloo Townhouse $324 $344 6.17%
Hamilton Townhouse $257 $350 $343 -2.05%
Kitchener Townhouse $323 $342 5.88%
Cambridge Townhouse $282 $317 $341 7.57%
St. Catharines Detached House $310 $290 $330 13.79%
Ottawa Detached House $215 $225 $258 $313 21.32%
Niagara Falls Detached House $275 $300 9.09%
London Detached House $201 $191 $237 $250 5.56%
Grey Bruce Detached House $175 $182 $195 7.38%
Owen Sound Detached House $145 $158 $167 5.89%

Quebec

CITY
HOUSE TYPE
2017 PPSF
2018 PPSF
2019 PPSF
2020 PPSF
% CHANGE 2019-2020
Montreal, Downtown and SW Detached House $514 $603 $674 $958 42.14%
Montreal, Downtown and SW Condo $533 $567 $709 $805 13.55%
Montreal, Downtown and SW Townhouse $462 $514 $533 $768 44.03%

Atlantic Canada

CITY
HOUSE TYPE
2017 PPSF
2018 PPSF
2019 PPSF
2020 PPSF
% CHANGE 2019-2020
Halifax Condo $228 $239 $270 12.97%
Charlottetown Detached House $138 $147 $165 $178 7.88%
Halifax Detached House $131 $155 $162 $170 4.94%
St. John’s Detached House $167 $137 $132 $135 2.83%
Moncton Detached House $100 $101 $106 $124 16.98%
Fredericton Detached House $99 $123 24.56%
Saint John Detached House $111 $123 10.86%
St. John’s Condo $174 $116 -33.48%

Northwest Territories

CITY
HOUSE TYPE
2017
2020
Yellowknife Detached House  $277.31  $277
Townhouse  $275.95  $265
Manufactured  $263.83  $267
Apartment  $332.93  $347
Duplex  $313.33  $306


About CENTURY 21 Canada®

CENTURY 21 Canada Limited Partnership (century21.ca) is a real estate master franchisor with complete rights to the CENTURY 21® brand in Canada.

The CENTURY 21 System is one of the world’s largest and most recognized residential real estate franchise sales organization with approximately 9,400 independently owned and operated franchised real estate offices worldwide and over 127,000 sales professionals. CENTURY 21 provides comprehensive technology, marketing, training, management, and administrative support for its members in 80 countries and territories worldwide. 

How the information was gathered by CENTURY 21 Canada

CENTURY 21 franchisees were asked to help come up with the average price-per-square-foot in their market. However, calculating a precise number is not an exact science as every office and province tracks statistics slightly differently. As a result, some have used either the average or benchmark prices (depending on the market) and tracked average square footage in sales from January 1 – June 30, 2020. The price-per-square-foot was calculated from those numbers. Each franchisee has confirmed that that the numbers provided are an accurate representation of their market. Some real estate boards adjust their statistics after the deadline so, in some markets, 2019 numbers were adjusted to better reflect the year over year trends.