 Facebook
 X
X
 Pinterest
 Copy Link
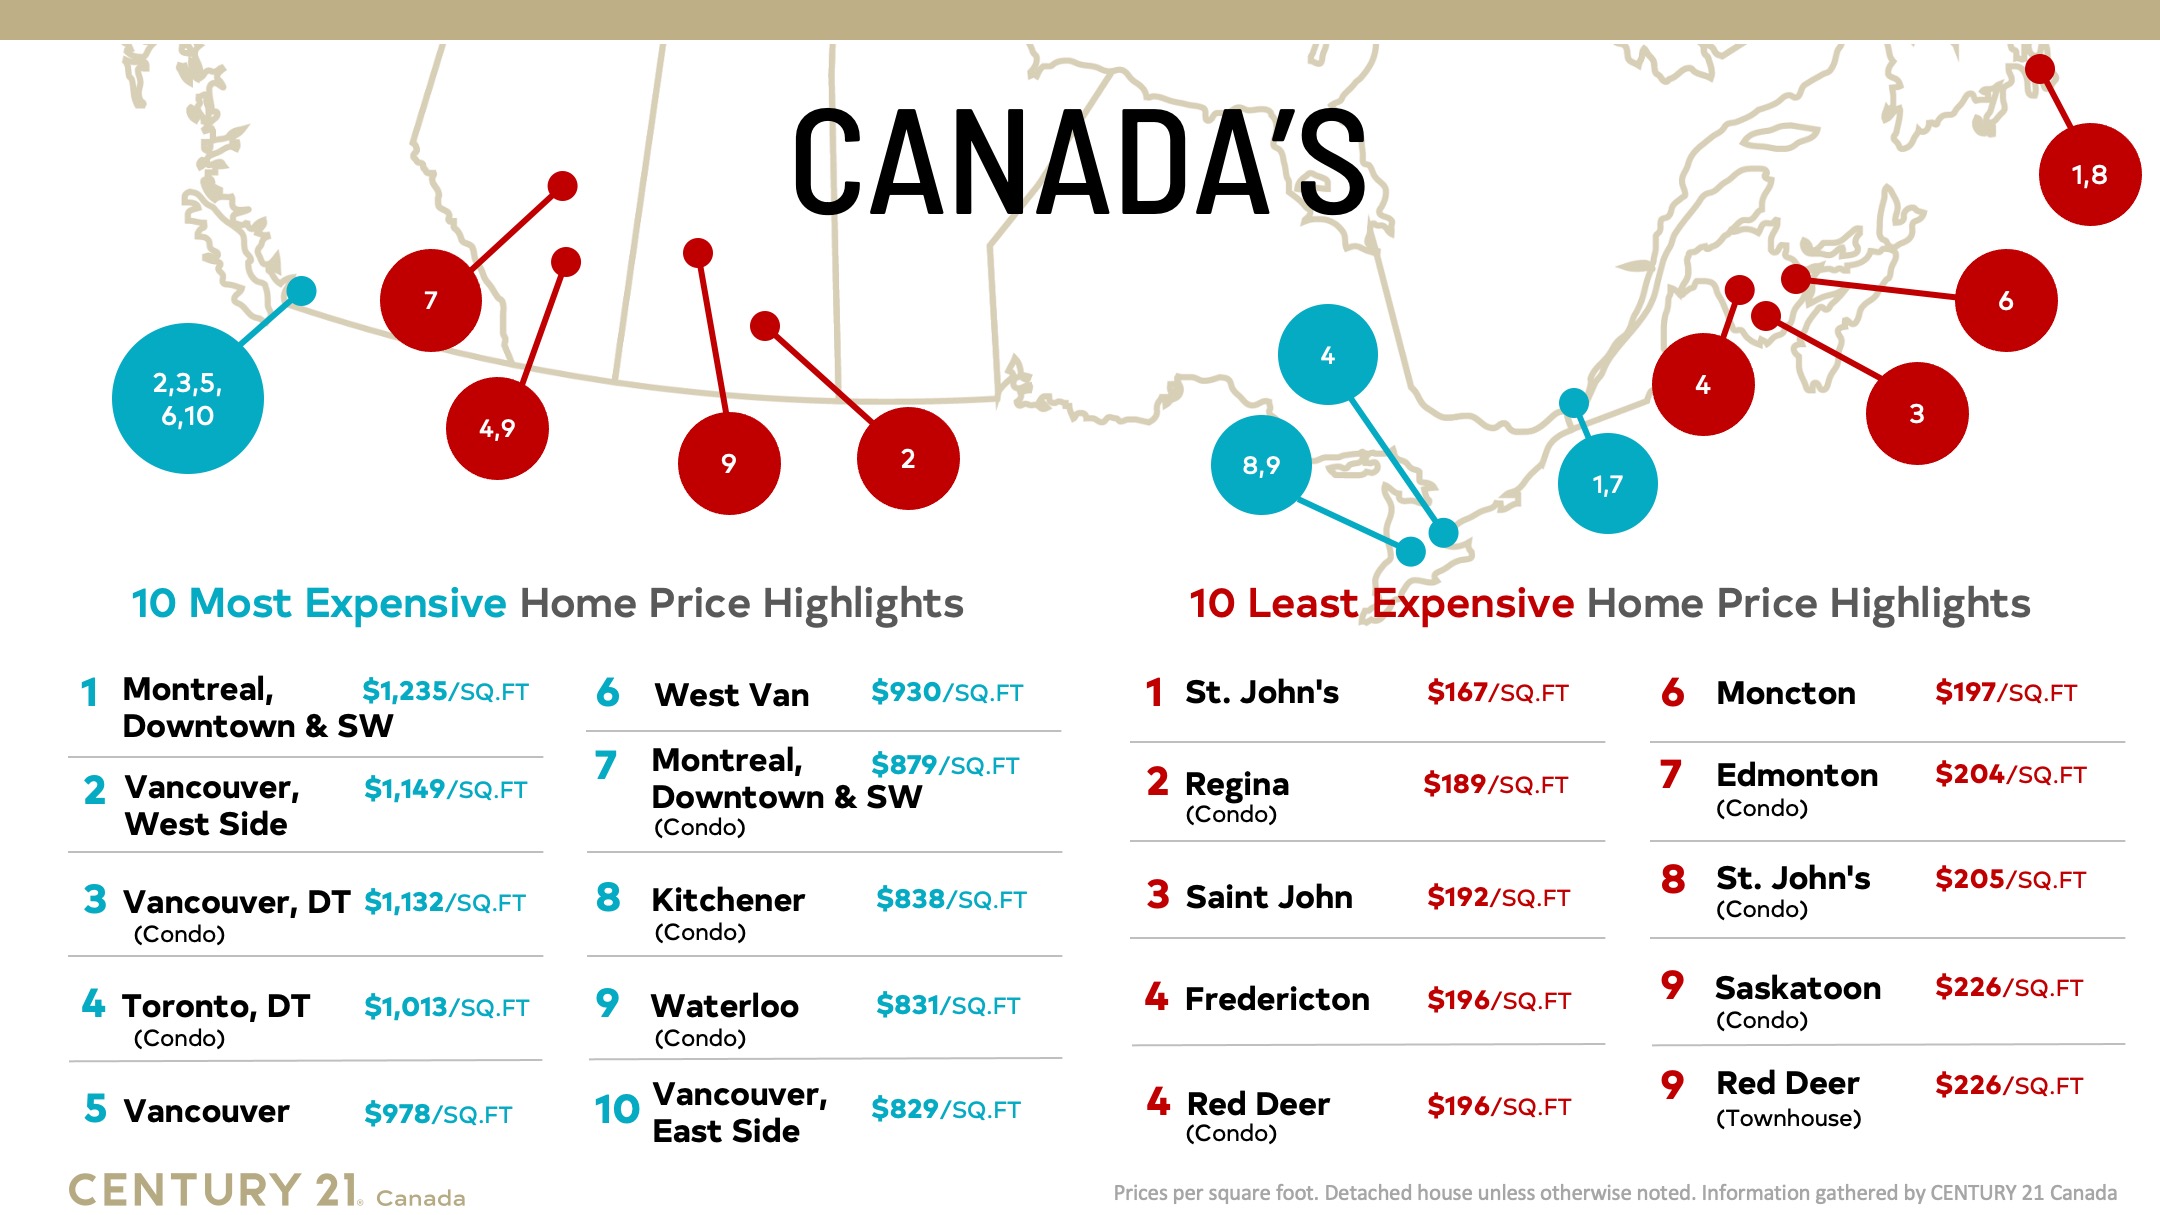
Interest rate hikes prompt modest decline in Canadian home prices, but no freefall in sight, impact uneven
Vancouver (Aug 2, 2022) – Canadian housing prices have fallen with rising interest rates, but when looking back over even just two years remain on a long-term upward trend. Even then, the situation is uneven. The hot housing markets of the biggest city centres are seeing lower condo prices but smaller markets are seeing price per square foot growth, especially in single-family homes. Alberta bucked the trend and experienced price increases in many markets this year, while other Prairie provinces held steady. BC saw the most significant price declines.
The seventh annual Price per Square Foot survey is being released by CENTURY 21 Canada, comparing the price per square foot of properties sold between January 1 and June 30 this year to the same period of previous years.
Notably, most markets that did experience price declines from last year remained roughly equivalent to their 2021 benchmarks and well above earlier years. This year’s survey offers data going back to 2018 for numerous communities coast-to-coast.
“We knew that the market had to come down from the highs of the last few years, and we’re now fully seeing the effects of the interest rate growth that started last year,” says Todd Shyiak, Executive Vice President of CENTURY 21 Canada. “But we have to look at these numbers within the larger context. The fact that we haven’t dipped to pre-pandemic levels shows that homes are still in demand, and we continue to see growth in smaller markets as more families seek a lower cost of living.”
Prices had reached low points in January but steadily climbed over the spring, though many markets didn’t manage to regain their 2022 levels. Condos in Vancouver, Toronto and Montreal all saw declines, while detached homes across small Ontario cities rose, as did those in Atlantic Canada, indicating families seeking space. New Brunswick is emerging as a leader in Atlantic Canadian growth. Results from the 2021 census showed that Moncton, Fredericton and St. John are seen as popular locations for immigrants, and the results from this year’s PPSF survey indicate that trend has continued.
Shyiak says that inventory will play a major factor in prices going forward, as sellers may hold off on putting their homes on the market in response to a hesitant buyer base. “Ultimately, we don’t know what the next six months holds for our housing prices, but it’s important not to get too focused on any single year and look at each data point within the larger context of ever evolving trends. That’s why this survey becomes more valuable year-over-year, because it allows us to see the big picture of Canadian housing.”
Regional highlights:
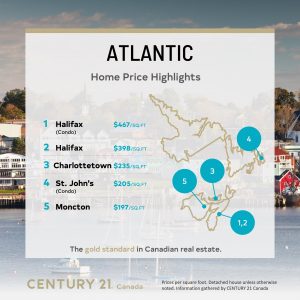
Atlantic Canada
Prices in Atlantic Canada have continued to rise as Canadians from expensive urban markets seek a lower cost of living. For the first year since this survey started Halifax has lost its crown as the market with the steepest rise as condos in that city saw the smallest increase in the region after a sharp double-digit increase last year. Detached homes in Fredericton, Moncton and St. John’s all saw double-digit increases.
“Families are finding this to be a great place to settle down. We’ve been seeing these trends for years but post-2020 is when it really took off,” says Paul Burns, Manager at CENTURY 21 A&T Countryside Realty. “Interest rates may have slowed the market down slightly, but I’m confident New Brunswick especially will continue to grow.”

British Columbia
The steep prices throughout BC seem to have finally reached their cooling point, with the province seeing the steepest price declines but generally to levels still at or above those from 2021. Even then, Vancouver boasts some of the most expensive price per square foot dwellings in Canada, and prices of both detached houses and condos in the surrounding suburbs remain comparatively high.
Cities farther from the metropolitan core such as Chilliwack and Kelowna have also seen dips, though prices climbed throughout the spring to remain above 2021 levels. The only BC region to see growth was Victoria, possibly indicating more Lower Mainlanders searching across the water for cheaper real estate.
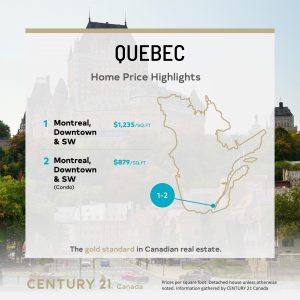
Quebec
Like the other Canadian metropolises, Montreal saw a dip in the price of condos and detached homes, but unlike Vancouver and Toronto the decline was modest and in the single digits. “A lot of young buyers like Montreal, and that’s helped keep the markets here relatively stable,” says Mohamad Al-Hajj, owner of CENTURY 21 Immo-Plus. “We’ll keep an eye on how the rest of the year goes, but it does look like things will remain steady.”
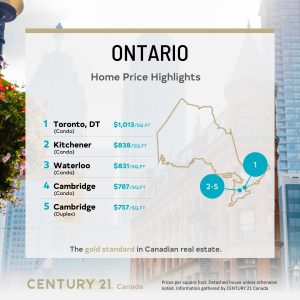
Ontario
Canada’s most populous province saw a wide range of change throughout, from declines to rises all over the map. Toronto condos remain expensive at a PPSF of $1,013, though this is a 16 per cent drop from 2022 to a level roughly in line with 2021 and 2020 prices. However, cities like Niagara Falls and Cambridge saw their family home types gain in the double-digits, and they lead an overall trend of cities farther away from the GTA seeing growth in the price of single-family homes.
“The trend of families looking for space away from the downtown core continues,” says Eryn Richardson, owner of CENTURY 21 Heritage Group. “The changing interest rates definitely had an impact on the prices as buyers are more hesitant, but no single market has fallen dramatically and we’re still seeing a lot of growth.”

Prairies
The Prairies have remained relatively steady with minor gains and losses across the board. Saskatoon detached homes lead the pack at a PPSF of $344, a testament to families who come to the region for space and lower costs. Winnipeg, Brandon and Regina continue the trend, seeing their detached single family homes at $291, $276 and $275 respectively. The most significant decline was in Winnipeg, but even there detached homes fell just 7.62 per cent in price per square foot – the moderate change reflecting the stability of the region.
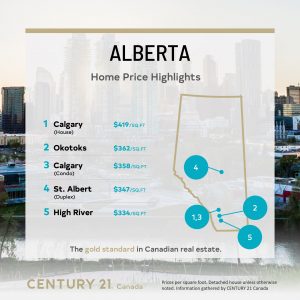
Alberta
Overall, Alberta has seen the most growth over the past year, with consistent price per square foot gains in most markets. Growth was modest but steady over the first half of 2023, and regions that saw declines dipped no further than 2020 levels. Edmonton condos were among those to decline, a potential sign of younger and newer buyers being affected by rising interest rates.
However, condos in Okotoks rose 14 per cent in price, a good indication that smaller towns still have the potential to grow fast as buyers explore new options. Just north, Calgary saw a rise of 5.81 per cent in single-family homes and 9.82 per cent in condos, while Red Deer was largely unchanged.
“Alberta has really emerged as a viable option for a lot of buyers who are leaving the more expensive areas of BC. Buyers both young and established are finding homes that fit their needs,” says George Bamber, owner of CENTURY 21 Bamber Realty. “Not only are they getting cheaper housing, but they’re also finding vibrant and fast-growing communities that they can make their own.”
CENTURY 21 Canada’s annual survey of data on the price per square foot (PPSF) of properties gathers and compares sales data from its franchises across Canada from January 1 to June 30 of each year. By looking at the price per square foot at the same time each year the firm is able to get a good idea of how prices have changed over time for similar properties. This year’s survey compares 2022 prices with this year’s results.
See the full PPSF study results below.
| ALBERTA | House Type | 2018 | 2019 | 2020 | 2021 | 2022 | 2023 | % Change from 2022 |
| Calgary | House | $341 | $325 | $320 | $355 | $396 | $419 | 5.81% |
| Calgary | Condo | $329 | $317 | $296 | $303 | $326 | $358 | 9.82% |
| Edmonton | Detached House | $288 | $272 | $268 | $284 | $297 | $309 | 4.04% |
| Edmonton | Duplex | $275 | $256 | $250 | $270 | $287 | $292 | 1.74% |
| Edmonton | Condo | $231 | $220 | $206 | $217 | $222 | $204 | -8.11% |
| High River | Detached House | $193 | $215 | $237 | $271 | $307 | $334 | 8.79% |
| High River | Condo | N/A | $241 | $173 | $176 | $223 | $233 | 4.48% |
| Okotoks | Detached House | N/A | $238 | $254 | $283 | $338 | $362 | 7.10% |
| Okotoks | Condo | N/A | $254 | $211 | $219 | $251 | $288 | 14.74% |
| Red Deer | Detached House | $276 | $262 | $252 | $289 | $293 | $294 | 0.34% |
| Red Deer | Townhouse | N/A | N/A | N/A | $207 | $214 | $226 | 5.61% |
| Red Deer | Condo | N/A | N/A | N/A | $186 | $194 | $196 | 1.03% |
| Red Deer | Duplex | N/A | N/A | N/A | N/A | $269 | $264 | -1.86% |
| St. Albert | Detached House | $287 | $271 | $269 | $289 | $322 | $317 | -1.55% |
| St. Albert | Condo | $239 | $223 | $211 | $251 | $238 | $259 | 8.82% |
| St. Albert | Duplex | $262 | $272 | $278 | $280 | $325 | $347 | 6.77% |
| BRITISH COLUMBIA | House Type | 2018 | 2019 | 2020 | 2021 | 2022 | 2023 | % Change from 2022 |
| Chilliwack | Detached House | $297 | $294 | $288 | $406 | $515 | $419 | -18.64% |
| Chilliwack | Townhouse | $267 | $249 | $250 | $318 | $425 | $359 | -15.53% |
| Chilliwack | Condo/ Apartment | $283 | $290 | $270 | $351 | $473 | $443 | -6.34% |
| Kelowna | Detached House | $283 | $274 | $280 | $368 | $463 | $413 | -10.80% |
| Kelowna | Half Duplex | $247 | $260 | $263 | $320 | $402 | $362 | -9.95% |
| Kelowna | Townhouse | $292 | $287 | $302 | $365 | $452 | $422 | -6.64% |
| Kelowna | Apartment | $345 | $348 | $334 | $411 | $526 | $491 | -6.65% |
| Vancouver | Detached House | $856 | $769 | $816 | $975 | $1,177 | $978 | -16.91% |
| Vancouver, Downtown | Condo | $856 | $769 | $1,060 | $1,053 | $1,133 | $1,132 | -0.09% |
| Vancouver, East side | Detached House | $721 | $647 | $672 | $877 | $957 | $829 | -13.38% |
| Vancouver, West Side | Detached House | $1,147 | $990 | $1,004 | $1,208 | $1,421 | $1,149 | -19.14% |
| Burnaby | Detached House | $599 | $551 | $579 | $688 | $795 | $725 | -8.81% |
| West Van | Detached House | $899 | $738 | $734 | $971 | $1,038 | $930 | -10.40% |
| Vancouver, Richmond | Detached House | $677 | $598 | $608 | $722 | $831 | $773 | -6.98% |
| Delta North | Detached House | $423 | $400 | $413 | $570 | $716 | $594 | -17.04% |
| North Vancouver | Detached House | $681 | $613 | $690 | $794 | $910 | $817 | -10.22% |
| White Rock/South Surrey | Detached House | $506 | $472 | $435 | $625 | $795 | $627 | -21.13% |
| Victoria | Detached House | N/A | N/A | N/A | $558 | $592 | $602 | 1.69% |
| Victoria | Townhouse | N/A | N/A | N/A | $457 | $583 | $553 | -5.15% |
| Victoria | Condo | N/A | N/A | N/A | $659 | $676 | $723 | 6.95% |
| ATLANTIC | House Type | 2018 | 2019 | 2020 | 2021 | 2022 | 2023 | % Change from 2022 |
| Charlottetown | Detached House | $147 | $165 | $178 | $211 | $245 | $235 | -4.08% |
| Fredericton | Detached House | N/A | $99 | $123 | $147 | $170 | $196 | 15.29% |
| Halifax | Detached House | $155 | $162 | $170 | $281 | $408 | $398 | -2.45% |
| Halifax | Condo | $228 | $239 | $270 | $291 | $450 | $467 | 3.78% |
| Moncton | Detached House | $101 | $106 | $124 | $142 | $173 | $197 | 13.87% |
| Saint John | Detached House | N/A | $111 | $123 | $134 | $163 | $192 | 17.79% |
| St. John’s | Detached House | N/A | $132 | $135 | $149 | $167 | $167 | 0.00% |
| St. John’s | Condo | N/A | $174 | $116 | $182 | $212 | $205 | -3.30% |
| PRAIRIES | House Type | 2018 | 2019 | 2020 | 2021 | 2022 | 2023 | % Change from 2022 |
| Regina | Detached House | $254 | $246 | $237 | $250 | $284 | $275 | -3.17% |
| Regina | Condo | $236 | $213 | $205 | $205 | $194 | $189 | -2.58% |
| Saskatoon | Detached House | $270 | $263 | $263 | $314 | $336 | $344 | 2.38% |
| Saskatoon | Condo | $208 | $213 | $217 | $216 | $219 | $226 | 3.20% |
| Winnipeg | Detached House | $282 | $243 | $244 | $293 | $315 | $291 | -7.62% |
| Winnipeg | Condo | $261 | $220 | $223 | $234 | $254 | $249 | -1.97% |
| Winnipeg | Attached | N/A | $202 | $210 | $241 | $269 | $258 | -4.09% |
| Brandon | Detached House | $248 | $246 | $248 | $271 | $276 | $276 | 0.00% |
| Brandon | Condo | $196 | $204 | $204 | $203 | $243 | $236 | -2.88% |
| ONTARIO | House Type | 2018 | 2019 | 2020 | 2021 | 2022 | 2023 | % Change from 2022 |
| Barrie | Detached House | $283 | $350 | $350 | $378 | $503 | $524 | 4.17% |
| Bradford | Detached House | $286 | $345 | $358 | $410 | $580 | $617 | 6.38% |
| Cambridge | Detached House | $332 | $355 | $388 | $450 | $625 | $670 | 7.20% |
| Cambridge | Duplex | $311 | $331 | $377 | $527 | $656 | $757 | 15.40% |
| Cambridge | Condo | $344 | $347 | $367 | $435 | $716 | $787 | 9.92% |
| Cambridge | Townhouse | $282 | $317 | $341 | $474 | $616 | $575 | -6.66% |
| Grey Bruce | Detached House | $175 | $182 | $195 | $357 | $455 | $434 | -4.62% |
| Guelph | Detached House | $397 | $409 | $443 | $483 | $690 | $527 | -23.62% |
| Guelph | Condo | $374 | $402 | $423 | $511 | $777 | $740 | -4.76% |
| Guelph | Duplex | $348 | $362 | $400 | $451 | $648 | $691 | 6.64% |
| Guelph | Townhouse | $311 | $335 | $364 | $433 | $641 | $605 | -5.62% |
| Hamilton | Detached House | $362 | $378 | $406 | $532 | $553 | $530 | -4.16% |
| Hamilton | Townhouse | $257 | $350 | $343 | $453 | $538 | $482 | -10.41% |
| Kitchener | Detached House | $339 | $359 | $400 | $430 | $618 | $610 | -1.29% |
| Kitchener | Semi-Detached | N/A | $341 | $399 | $460 | $623 | $632 | 1.44% |
| Kitchener | Townhouse | N/A | $323 | $342 | $435 | $576 | $583 | 1.22% |
| Kitchener | Condo | $328 | $362 | $399 | $483 | $800 | $838 | 4.75% |
| London | Detached House | $191 | $237 | $250 | $362 | $466 | $384 | -17.60% |
| Markham | Detached House | N/A | N/A | $485 | $557 | $685 | $753 | 9.93% |
| Niagara Falls | Bungalow | N/A | $336 | $395 | $475 | $630 | $746 | 18.41% |
| Niagara Falls | Detached House | N/A | $275 | $300 | $390 | $531 | $606 | 14.12% |
| Newmarket | Detached House | N/A | $372 | $510 | $505 | $516 | $536 | 3.88% |
| Ottawa | Detached House | $225 | $258 | $313 | $429 | $465 | $502 | 7.96% |
| Ottawa | Townhouse | N/A | N/A | N/A | $392 | $451 | $419 | -7.10% |
| Ottawa | Condo | $442 | $485 | $577 | $479 | $583 | $552 | -5.32% |
| Owen Sound | Detached House | $145 | $158 | $167 | $312 | $380 | $393 | 3.42% |
| Richmond Hill | Detached House | $445 | $465 | $522 | $520 | $665 | $717 | 7.82% |
| St. Catharines | Bungalow | $385 | $367 | $425 | $520 | $589 | $639 | 8.49% |
| St. Catharines | Detached House | $310 | $290 | $330 | $400 | $612 | $636 | 3.92% |
| Toronto, Downtown | Condo | $903 | $994 | $1,083 | $956 | $1,217 | $1,013 | -16.76% |
| Vaughn | Detached House | $434 | $503 | $548 | $612 | $695 | $687 | -1.15% |
| Waterloo | Detached House | N/A | $372 | $407 | $421 | $613 | $520 | -15.17% |
| Waterloo | Semi-detached | N/A | $357 | $399 | $439 | $648 | $663 | 2.31% |
| Waterloo | Townhouse | N/A | $324 | $344 | $408 | $641 | $651 | 1.56% |
| Waterloo | Condo | N/A | $402 | $411 | $503 | $777 | $831 | 6.95% |
| Windsor | Detached House | N/A | $372 | $407 | $295 | $306 | $469 | 53.27% |
| QUEBEC | House Type | 2018 | 2019 | 2020 | 2021 | 2022 | 2023 | % Change from 2022 |
| Montreal, Downtown and SW | Condo | $567 | $709 | $805 | $935 | $935 | $879 | -5.99% |
| Montreal, Downtown and SW | Detached House | $603 | $674 | $958 | $1,350 | $1,357 | $1,235 | -8.99% |

