 Facebook
 X
X
 Pinterest
 Copy Link
National real estate survey finds home prices holding steady, sales coming back after decline early in pandemic
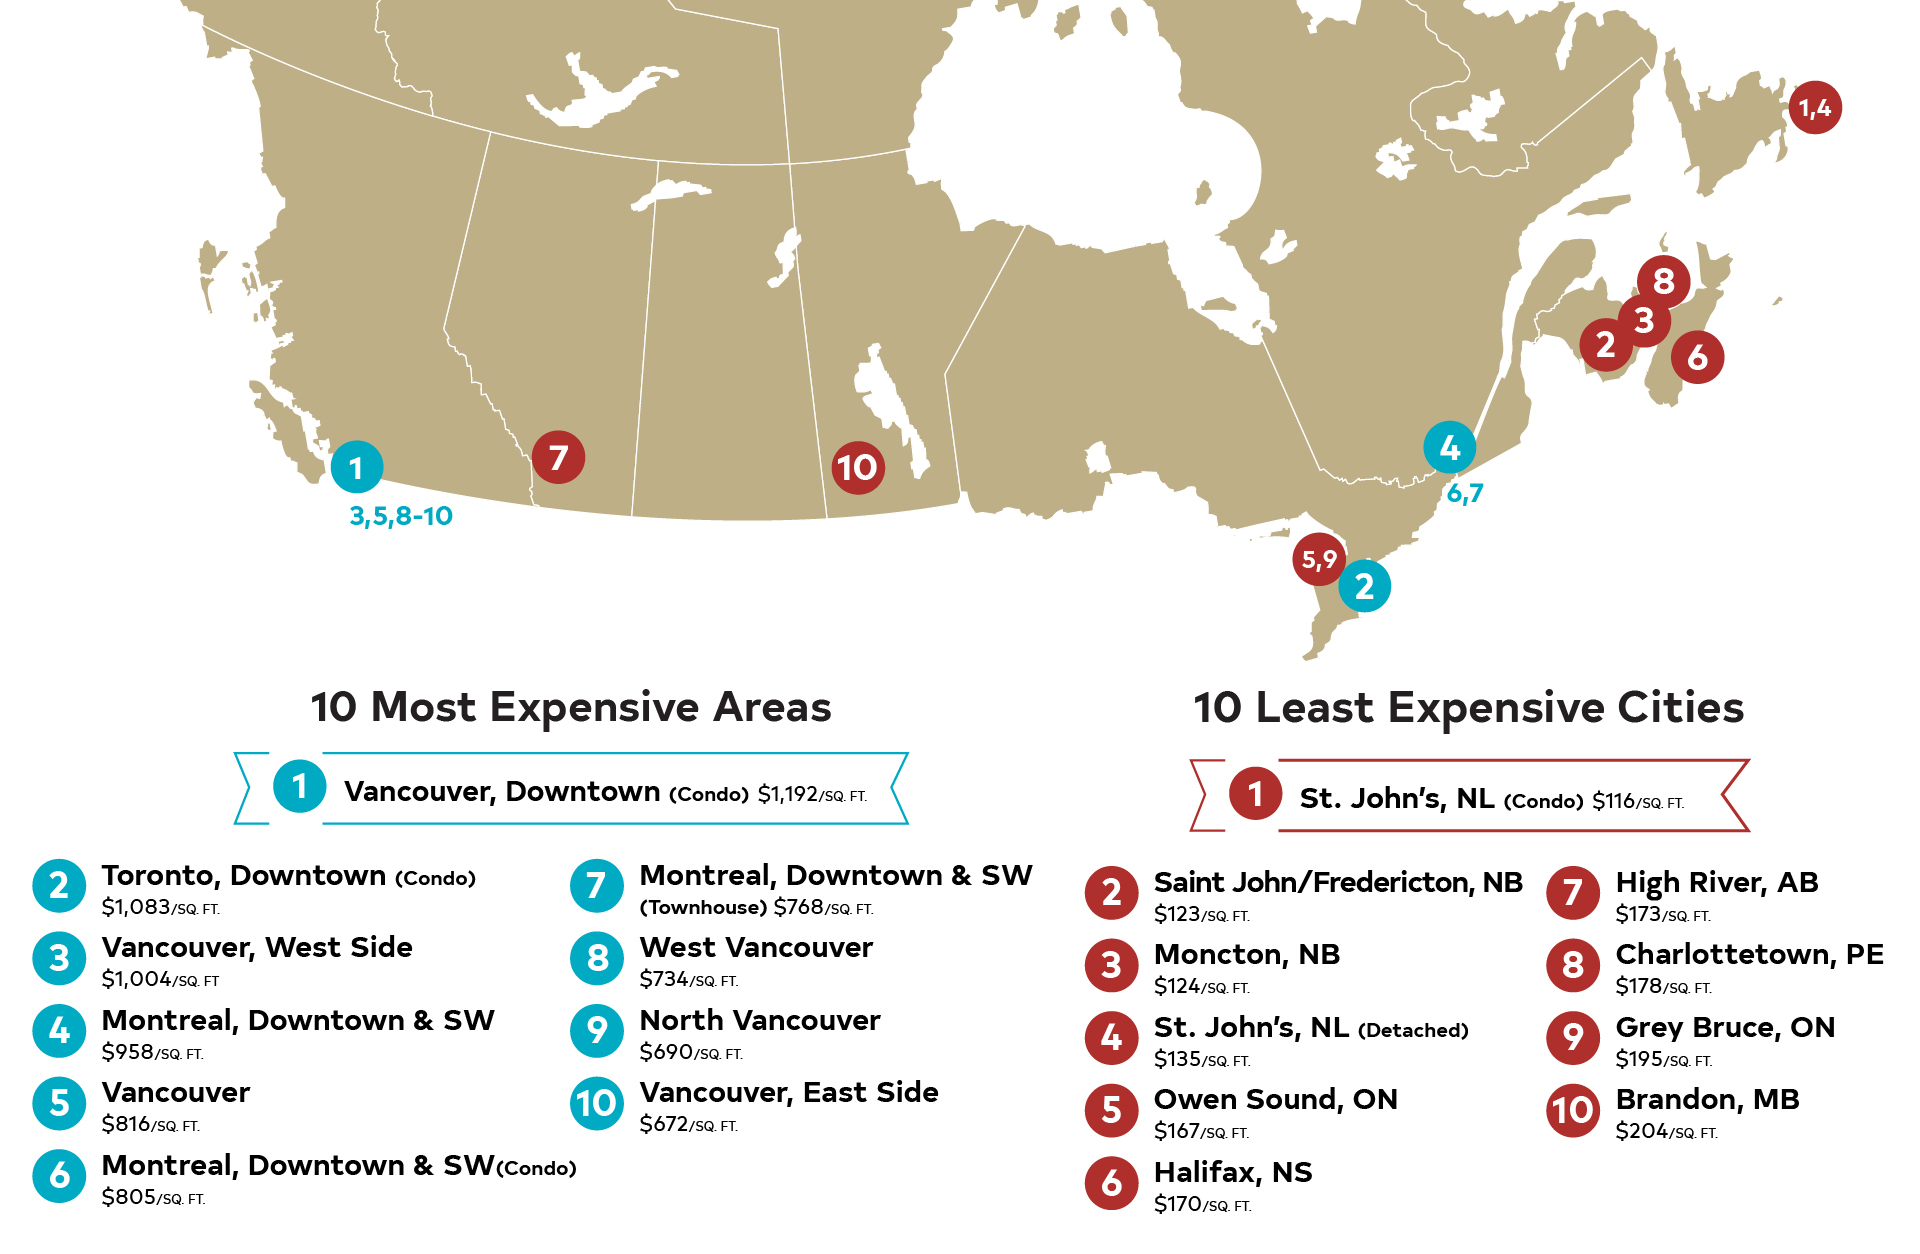
Vancouver (August 24, 2020) – An annual report out from CENTURY 21 Canada today reveals house prices across Canada are maintaining their strength, while the number of sales is coming back after a decline earlier in the spring due to the COVID-19 pandemic. While the local stories vary across the country, the common theme is of house prices seeing modest changes per square foot over the same period last year. One exception is Montreal, which has seen prices increase dramatically since 2019 – though downtown prices still remain lower than those in Vancouver and Toronto.
In its annual, nationwide study, CENTURY 21 Canada compared the price per square foot of properties sold between January 1 and June 30 this year, compared to the same period last year.
“When the pandemic took hold in Canada in mid-March, there was a lot of uncertainty about what would happen to real estate sales during the typically busy spring market,” says Brian Rushton, Executive Vice-President of CENTURY 21 Canada. “What we have seen is that after a dip in the number of sales early in the pandemic, the pace of sales has returned to near-normal levels as real estate agents and companies innovated new ways of doing things. The real estate industry has proved resilient through the past several months. And even further, prices have held steady as well.”
As it has in many sectors of Canada’s economy, COVID-19 has prompted innovations in how real estate operations, with the adoption of technologies allowing more physical distancing and reducing contact. CENTURY 21 Canada has made additional tools available to sales representatives in order to facilitate the change. Virtual tours are now very popular so that a seller does not have strangers or large numbers of people in their homes. The company encourages all agents to host online open houses through Facebook Live. CENTURY 21 Canada has also recently partnered with an international company, EyeSpy360, which allows a virtual home tour that can be done as a walk-through and presented to a client via email or a live presentation.
Regional highlights:
Quebec
The strongest real estate market in Canada right now is Montreal, with prices increasing significantly since last year, particularly in the downtown detached house and townhouse markets. The price of a detached house in Montreal’s downtown and southwest rose 42.14 per cent to $958 per square foot, while townhouses came up 44 per cent to $768 and condos 13.55 per cent to $805. While prices in Montreal remain lower than those in Vancouver and Toronto they are catching up as prices in those other centres saw more modest increases or even declines. “Even though real estate in Quebec was not considered an essential service, we have seen strong demand and a jump in prices in 2020,” says Mohamad Al-Hajj, owner of CENTURY 21 Immo-Plus in Montreal.

Ontario
Prices have continued to increase in communities across Ontario, particularly just outside the GTA. Newmarket has seen the biggest increase since last year with prices for single family detached houses climbing 37.29 percent, while in Kitchener semi-detached homes increased 17 percent to $399 per square foot. Ottawa is also proving to be strong with increases of about 20 per cent – houses increasing to $313 per square foot and condos to $577 per square foot. Downtown Toronto condos increased 8.9 per cent per square foot to $1,083 – breaking the $1,000 mark. Downtown Toronto condos remain the second most expensive in Canada, after Vancouver condos. Hamilton, meanwhile, saw modest decreases in price per square foot. Rushton says, “With a work from home option more realistic for some people, they’re finding they can get a larger home if they move a bit further from Toronto. Even if their commute is a little longer they’re traveling to an office less often, which makes it more tolerable.”

British Columbia
BC property prices often receive attention from across the country, but in 2020 saw only minor changes, especially compared to increases seen in previous years. Downtown Vancouver condos decreased modestly in price per square foot (down 3.97 per cent to $1,192), but remained the most expensive properties in Canada – though prices for condos in Toronto and Montreal are catching up. Prices of detached houses in City of Vancouver neighbourhoods increased modestly, as did homes in North Vancouver (up 4.75 percent to $690 per square foot), Burnaby (up 5.2 per cent to $579 per square foot), and Richmond (up 1.73 per cent to $608). Both Chilliwack and White Rock/South Surrey saw modest declines, dropping 6.78 percent and 7.81 percent respectively.

Prairies
Prairie house prices continue to be the most affordable in Canada other than those in the Atlantic provinces, and have generally remained flat over the past year. Rural Alberta was an exception, with a soft condo market in some communities. Condos in High River, Alberta have dropped more than 28 percent to $173 per square foot, though in the same community prices for a detached house rose 10.4 per cent to $237 per square foot. Okotoks and St. Albert saw similar trends, though not as marked. In In Edmonton, houses and condos have dropped modestly Calgary house prices have dropped 1.54 per cent to $320 per square foot, while condos have dropped 6.62 per cent. “This is an area that has long relied on the oil and gas industry,” says George Bamber, Owner of CENTURY 21 Bamber Realty in Calgary. “Continued uncertainty in that sector is keeping prices from growing.”
Prices for both condos and detached houses declined almost four per cent in Regina, and were flat in Saskatoon, Brandon, and Winnipeg.

Atlantic
Most of Atlantic Canada saw strong price increases over the last year, though the region remains the most affordable place to purchase real estate in Canada. St. John’s is the exception, where weak industry forced prices for condos down 33.4 per cent to $116 per square foot, while house prices remained flat (up 1.33 per cent to $135). However, Fredericton house prices shot up 24.56 per cent to $123, while Moncton houses rose 19.98 per cent to $124. Condo prices in Halifax remained the highest in the region, up 12.97 per cent to $270 per square foot – on par with a home in Edmonton but lower than those in Calgary. “We’ve seen great interest in home purchases in our area in 2020. I think people see the value in homes here and are looking for a place to put down roots. This region provides affordable housing and a great lifestyle,” says Paul Burns, Manager at CENTURY 21 A&T Countryside Realty.
This is the fourth consecutive year CENTURY 21 Canada has gathered and released this report of local prices per square foot.
“As we are in our fourth year of gathering this data, we continue to see that real estate is not a national picture, it’s really what’s happening in your local community,” says Mr. Rushton. “No matter where in Canada you live buying a home is a great investment, especially if you’re making a long-term purchase.”
CENTURY 21 Canada’s annual survey of data on the price per square foot (PPSF) of properties gathers and compares sales data from its franchises across Canada from January 1 to June 30 of each year. By looking at the price per square foot at the same time each year the firm is able to get a good idea of how prices have changed over time for similar properties. This year’s survey compares 2019 prices with this year’s results, while also providing available 2017 and 2018 data.
For more information please contact:
Leigh Kjekstad | Director of Brand Engagement
Phone: (604) 606-2139
Email: Leigh.Kjekstad@century21.ca
British Columbia
CITY |
HOUSE TYPE |
2017 PPSF |
2018 PPSF |
2019 PPSF |
2020 PPSF |
% CHANGE 2019-2020 |
| Vancouver, Downtown | Condo | $963 | $1,345 | $1,241 | $1,192 | -3.97% |
| Vancouver, West Side | Detached House | $1,210 | $1,147 | $990 | $1,004 | 1.47% |
| Vancouver | Detached House | $890 | $856 | $769 | $816 | 6.09% |
| West Van | Detached House | $817 | $899 | $738 | $734 | -0.45% |
| North Vancouver | Detached House | $626 | $681 | $613 | $690 | 12.58% |
| Vancouver, East side | Detached House | $719 | $721 | $647 | $672 | 3.84% |
| Victoria | Condo | $615 | N/A | |||
| Vancouver, Richmond | Detached House | $614 | $677 | $598 | $608 | 1.73% |
| Burnaby | Detached House | $588 | $599 | $551 | $579 | 5.20% |
| Victoria | Detached House | $458 | $509 | $442 | $488 | 10.41% |
| Victoria- Western Communities | Condo | $460 | N/A | |||
| White Rock/South Surrey | Detached House | $554 | $506 | $472 | $435 | -7.81% |
| Victoria | Townhouse | $418 | N/A | |||
| Delta North | Detached House | $370 | $423 | $400 | $413 | 3.21% |
| Victoria- Western Communities | Detached House | $346 | N/A | |||
| Victoria- Western Communities | Townhouse | $346 | N/A | |||
| Kelowna | Apartment | $314 | $345 | $348 | $334 | -3.84% |
| Kelowna | Townhouse | $268 | $292 | $287 | $302 | 5.45% |
| Chilliwack | Detached House | $259 | $297 | $294 | $288 | -1.99% |
| Kelowna | Detached House | $263 | $283 | $274 | $280 | 2.35% |
| Chilliwack | Condo/ Apartment | $198 | $283 | $290 | $270 | -6.78% |
| Kelowna | Half Duplex | $232 | $247 | $260 | $263 | 1.41% |
| Chilliwack | Townhouse | $208 | $267 | $249 | $250 | 0.40% |
Alberta
CITY |
HOUSE TYPE |
2017 PPSF |
2018 PPSF |
2019 PPSF |
2020 PPSF |
% CHANGE 2019-2020 |
| Calgary | House | $341 | $325 | $320 | -1.54% | |
| Calgary | Condo | $329 | $317 | $296 | -6.62% | |
| St. Albert | Duplex | $274 | $262 | $272 | $278 | 2.23% |
| St. Albert | Detached House | $290 | $287 | $271 | $269 | -0.62% |
| Edmonton | Detached House | $289 | $288 | $272 | $268 | -1.37% |
| Okotoks | Detached House | $238 | $254 | 6.67% | ||
| Red Deer | Detached House | $282 | $276 | $262 | $252 | -3.96% |
| Edmonton | Duplex | $261 | $275 | $256 | $250 | -2.35% |
| High River | Detached House | $202 | $193 | $215 | $237 | 10.40% |
| Okotoks | Condo | $254 | $211 | -16.65% | ||
| St. Albert | Condo | $247 | $239 | $223 | $211 | -5.57% |
| Edmonton | Condo | $261 | $231 | $220 | $206 | -6.00% |
| High River | Condo | $241 | $173 | -28.26% |
Prairies
CITY |
HOUSE TYPE |
2017 PPSF |
2018 PPSF |
2019 PPSF |
2020 PPSF |
% CHANGE 2019-2020 |
| Saskatoon | Detached House | $296 | $270 | $263 | $263 | 0.00% |
| Brandon | Detached House | $248 | $248 | $246 | $248 | 0.86% |
| Winnipeg | Detached House | $267 | $282 | $243 | $244 | 0.33% |
| Regina | Detached House | $263 | $254 | $246 | $237 | -3.74% |
| Winnipeg | Condo | $261 | $220 | $223 | 1.48% | |
| Saskatoon | Condo | $231 | $208 | $213 | $217 | 2.00% |
| Winnipeg | Attached | $202 | $210 | 4.19% | ||
| Regina | Condo | $246 | $236 | $213 | $205 | -3.86% |
| Brandon | Condo | $201 | $196 | $204 | $204 | -0.11% |
Ontario
CITY |
HOUSE TYPE |
2017 PPSF |
2018 PPSF |
2019 PPSF |
2020 PPSF |
% CHANGE 2019-2020 |
| Toronto, Downtown | Condo | $819 | $903 | $994 | $1,083 | 8.91% |
| Ottawa | Condo | $442 | $485 | $577 | 18.97% | |
| Vaughn | Detached House | $434 | $503 | $548 | 8.91% | |
| Richmond Hill | Detached House | $585 | $445 | $465 | $522 | 12.29% |
| Newmarket | Detached House | $372 | $510 | 37.29% | ||
| Markham | Detached House | $485 | N/A | |||
| Guelph | Detached House | $380 | $397 | $409 | $443 | 8.31% |
| St. Catharines | Bungalow | $385 | $367 | $425 | 15.80% | |
| Guelph | Condo | $374 | $402 | $423 | 5.22% | |
| Waterloo | Condo | $402 | $411 | 2.24% | ||
| Waterloo | Detached House | $372 | $407 | 9.41% | ||
| Hamilton | Detached House | $362 | $378 | $406 | 7.40% | |
| Guelph | Duplex | $330 | $348 | $362 | $400 | 10.50% |
| Kitchener | Detached House | $320 | $339 | $359 | $400 | 11.42% |
| Kitchener | Semi-Detached | $341 | $399 | 17.01% | ||
| Kitchener | Condo | $328 | $362 | $399 | 10.22% | |
| Waterloo | Semi-detached | $357 | $399 | 11.76% | ||
| Niagara Falls | Bungalow | $336 | $395 | 17.56% | ||
| Cambridge | Detached House | $325 | $332 | $355 | $388 | 9.30% |
| Cambridge | Duplex | $300 | $311 | $331 | $377 | 13.90% |
| Hamilton | Apartment/ Condo | $234 | $376 | $370 | -1.72% | |
| Cambridge | Condo | $344 | $347 | $367 | 5.76% | |
| Guelph | Townhouse | $311 | $335 | $364 | 8.66% | |
| Bradford | Detached House | $286 | $345 | $358 | 3.93% | |
| Barrie | Detached House | $283 | $350 | $350 | 0.00% | |
| Waterloo | Townhouse | $324 | $344 | 6.17% | ||
| Hamilton | Townhouse | $257 | $350 | $343 | -2.05% | |
| Kitchener | Townhouse | $323 | $342 | 5.88% | ||
| Cambridge | Townhouse | $282 | $317 | $341 | 7.57% | |
| St. Catharines | Detached House | $310 | $290 | $330 | 13.79% | |
| Ottawa | Detached House | $215 | $225 | $258 | $313 | 21.32% |
| Niagara Falls | Detached House | $275 | $300 | 9.09% | ||
| London | Detached House | $201 | $191 | $237 | $250 | 5.56% |
| Grey Bruce | Detached House | $175 | $182 | $195 | 7.38% | |
| Owen Sound | Detached House | $145 | $158 | $167 | 5.89% |
Quebec
CITY |
HOUSE TYPE |
2017 PPSF |
2018 PPSF |
2019 PPSF |
2020 PPSF |
% CHANGE 2019-2020 |
| Montreal, Downtown and SW | Detached House | $514 | $603 | $674 | $958 | 42.14% |
| Montreal, Downtown and SW | Condo | $533 | $567 | $709 | $805 | 13.55% |
| Montreal, Downtown and SW | Townhouse | $462 | $514 | $533 | $768 | 44.03% |
Atlantic Canada
CITY |
HOUSE TYPE |
2017 PPSF |
2018 PPSF |
2019 PPSF |
2020 PPSF |
% CHANGE 2019-2020 |
| Halifax | Condo | $228 | $239 | $270 | 12.97% | |
| Charlottetown | Detached House | $138 | $147 | $165 | $178 | 7.88% |
| Halifax | Detached House | $131 | $155 | $162 | $170 | 4.94% |
| St. John’s | Detached House | $167 | $137 | $132 | $135 | 2.83% |
| Moncton | Detached House | $100 | $101 | $106 | $124 | 16.98% |
| Fredericton | Detached House | $99 | $123 | 24.56% | ||
| Saint John | Detached House | $111 | $123 | 10.86% | ||
| St. John’s | Condo | $174 | $116 | -33.48% |
Northwest Territories
CITY |
HOUSE TYPE |
2017 |
2020 |
| Yellowknife | Detached House | $277.31 | $277 |
| Townhouse | $275.95 | $265 | |
| Manufactured | $263.83 | $267 | |
| Apartment | $332.93 | $347 | |
| Duplex | $313.33 | $306 |
About CENTURY 21 Canada®
CENTURY 21 Canada Limited Partnership (century21.ca) is a real estate master franchisor with complete rights to the CENTURY 21® brand in Canada.
How the information was gathered by CENTURY 21 Canada
CENTURY 21 franchisees were asked to help come up with the average price-per-square-foot in their market. However, calculating a precise number is not an exact science as every office and province tracks statistics slightly differently. As a result, some have used either the average or benchmark prices (depending on the market) and tracked average square footage in sales from January 1 – June 30, 2020. The price-per-square-foot was calculated from those numbers. Each franchisee has confirmed that that the numbers provided are an accurate representation of their market. Some real estate boards adjust their statistics after the deadline so, in some markets, 2019 numbers were adjusted to better reflect the year over year trends.

