 Facebook
 X
X
 Pinterest
 Copy Link
CENTURY 21 Heritage Group Recognized with Seven 2025 Brandon Hall Awards for Excellence in Learning and Sales Enablement

Vancouver, BC – 2025 – CENTURY 21 Canada is proud to congratulate CENTURY 21 Heritage Group on being recognized with seven 2025 Brandon Hall Group Excellence Awards, celebrating the brokerage’s industry-leading commitment to learning and development through technology-driven innovation.
The awards span the HCM Excellence Awards, Learning & Development Technology Awards, and Sales Enablement Technology Awards, and collectively recognize the success of the brokerage’s Learning Management System, a comprehensive learning and performance ecosystem supporting real estate agents across Ontario.
The awards won include:
HCM Excellence Awards
- Gold — Best Learning Experience Platform (LXP) Implementation
- Bronze — Best Learning Technology Implementation
Learning & Development Technology Awards (All Gold)
- Best Advance in Learning Management Technology (LMT)
- Best Advance in Learning Management Technology for External Training
- Best Advance in Unique Learning Technology
Sales Enablement Technology Awards (All Gold)
- Best Advance in Emerging Sales Enablement Technology
- Best Advance in Sales Training Online Application
“These seven awards validate our long-term vision to build the most advanced, scalable, and agent-centric training ecosystem in Canadian real estate,” said Eryn Richardson, Managing Partner of CENTURY 21 Heritage Group. “Our partnership with NIIT Managed Training Services and the power of the Xsel platform have allowed us to deliver truly modern learning, performance tracking, and sales enablement at a level rarely seen in our industry.”
Richardson added, “This recognition is not just about technology — it’s about empowering our agents with systems that help them build stronger businesses, create better client experiences, and thrive in any market”.
The Xsel platform serves as the foundation of CENTURY 21 Heritage Group’s agent onboarding, certification, performance coaching, leadership development, and scalable training delivery. With more than 780 agents across Ontario, the brokerage operates one of the most advanced real estate training infrastructures in the country
Todd Shyiak, Executive Vice President of CENTURY 21 Canada, praised the brokerage’s achievement and leadership.
“CENTURY 21 Heritage Group continues to set the benchmark for what’s possible when innovation, leadership, and a true agent-first mindset come together,” said Shyiak. “Their leadership and long-term commitment to building scalable, future-ready systems is clearly reflected in this national and global recognition. At CENTURY 21 Canada, we’re proud to support franchisees like Heritage Group and remain deeply committed to investing in tools, training, and partnerships that help our network grow stronger in every market.”
An Open Letter to the Canadian Real Estate Industry

By Todd Shyiak, EVP, Century 21 Canada
The collapse of iPro Realty (with its 2,400 agents) was more than the failure of a single brokerage. It exposed deep fault lines across Canadian real estate—too many agents without training or oversight, brokerages chasing headcount over quality, and regulators who must strengthen their guardrails. If we want to restore consumer trust and protect agents’ livelihoods, we need structural change.
Here are three of the most pressing problems—and the solutions that can move us forward.
Problem 1: Weak Oversight From RECO
The Real Estate Council of Ontario (RECO) is tasked with regulating our industry and protecting both consumers and agents. Yet the iPro collapse revealed serious gaps in oversight—especially around the management of trust funds. Consumers will likely be made whole. Agents, however, face devastating financial losses from unpaid commissions.
The fact that the offending brokers, according to RECO, will not face charges is truly criminal. If the penalty for looting your trust account is nothing more than surrendering your license and riding off to a beach retirement, other brokers may be tempted to do the same thing.
Without stronger safeguards, we risk seeing more brokerages fail and more livelihoods put in jeopardy.
Solution: Stronger Safeguards and Accountability
- Enhanced Financial Audits and Reporting
Increase the frequency and depth of audits for brokerages handling trust funds. Require regular disclosures of trust account balances and transactions to identify irregularities early. - Mandatory Trust Fund Management Training
Require all brokers and agents to complete training on the legal and ethical handling of trust funds. Cover compliance requirements, best practices, and the consequences of mismanagement. - Whistleblower Protection and Reporting
Establish anonymous reporting channels and clear protections from retaliation. Agents and employees must feel safe raising concerns about financial irregularities or unethical practices.
These reforms would bring greater transparency, accountability, and confidence to the industry.
Problem 2: Boards and Associations Rely on Headcount
Real estate boards and associations thrive on membership numbers. In Ontario, agents pay between $2,400 and $3,000+ annually—up front—to remain licensed. Whether those agents close a single deal is irrelevant; the boards collect their money either way.
This creates an industry bloated with unproductive and untrained agents. It also allows boards to step into roles that should belong to brokers—offering training, technology, and events that enable low-cost “warehouse” brokerages to avoid responsibility.
Solution: A Subscription Model That Rewards Professionalism
Replace the annual upfront fee with a monthly subscription. Of that, a portion should be paid back to brokerages for each agent who completes three or more transactions annually.
This would:
- Reward brokers who invest in mentoring, training, technology, and accountability.
- Encourage in-person meetings, workshops, and real oversight.
- Shift boards and associations away from their “agent-first” focus and toward supporting brokers’ efforts to build value and professionalism.
By aligning incentives, boards would no longer profit from sheer headcount. Instead, they would support a culture where professional, productive agents thrive.
Problem 3: Brokerages That Prioritize Quantity Over Quality
Some brokerages focus on building large agent rosters but provide limited training, mentorship, or oversight. Their low-fee models often emphasize independence, which can be attractive to part-time agents but leave others without the guidance needed to build a long-term career in real estate.
This approach can create uneven service experiences for consumers and limit opportunities for agents to grow into confident, capable professionals.
Solution: Minimum Brokerage Standards
Every brokerage in Ontario should be held accountable for delivering a baseline level of professional development and oversight. Transaction fees should be aligned with the value of the brokerage’s service offering, not simply driven by a race to the lowest cost.
Every licensed Realtor should also:
- Attend mandatory in-person training on essential skills—professionalism & ethics, market knowledge, communication & negotiation, problem solving & adaptability, legal compliance, and client service.
- Work under a manager who is available to them and actively supports client interactions, presentation and negotiating skills, and especially the preparation of offers and handling of legal matters.
Brokerages should be recognized for fostering professionalism and agent growth, not just for the number of licensees they host. This ensures clients are well served and brokerages remain financially sustainable.
Rebuilding Trust
Consumers expect Realtors to be competent, ethical professionals. Agents expect their brokerages and regulators to safeguard their livelihoods. Both expectations have been shaken.
But iPro should not just be remembered as a failure. It must be treated as a turning point. By reforming how boards collect fees, raising standards for brokerages, and strengthening regulatory oversight, we can rebuild trust in Canadian real estate.
The solutions are clear. The only question is whether we have the will to act.
Price Per Square Foot Survey 2025
Biggest cities see biggest price drops as Canadian homebuyers react to economic uncertainty
Annual Price per Square Foot survey looks at prices back to 2018 for almost 50 Canadian communities – finds condo prices in metro markets dip while smaller Prairie and Atlantic communities shoot up
Vancouver (July 28, 2025) – Century 21 Canada’s annual Price per Square Foot survey reveals Canada has no one real estate story. The often talked about major urban markets of the GTA and Greater Vancouver area have seen price declines and, across the board, sales volumes have declined this year.
But less talked about is the contrast seen in some smaller communities in Atlantic Canada, Alberta, and the Prairies, where prices are up 10 – 30 per cent this year – but to rates still far below those in other metro centers.
The annual survey compares the price per square foot of properties sold in almost 50 communities, large and small and in every province, between January 1 and June 30 this year to the same period of previous years. In many cases, it has data going back to 2018 for both metro centers and smaller communities.
“We’ve seen huge variations in pricing trends in the first half of 2025, as people in different communities adjust to headlines and the uncertainty caused by the tariff situation in different ways,” says Todd Shyiak, Executive Vice President of CENTURY 21 Canada. “The GTA is seeing the toughest market in years, while we’re seeing price strength in some Alberta, Saskatchewan, Manitoba, and Atlantic Canada communities. Anecdotally, we are hearing from agents that many clients are seeking livable communities with lower real estate prices this year, continuing a trend we started seeing during the pandemic.”
He adds the survey looks at pricing trends over several years across Canada, and that this year the pricing data needs to be taken in context of overall sales volumes slowing due to economic uncertainty.
“That said, there are early signs the market became somewhat more active in June, at the end of our survey period, but overall we anticipate a “wait and see” approach from many prospective buyers and sellers for the rest of the year,” Shyiak says.
According to this year’s data Alberta, Saskatchewan, and Manitoba saw a continuation of past year’s upward price per square foot trends, indicating a sustained interest in the relatively affordable homes of the Prairie region. In that region larger markets generally saw smaller increases, even a few nominal declines, while mid-sized markets such as Red Deer, AB and Brandon, MB saw double-digit rises.
The steepest increases across the country were in the Atlantic region, with New Brunswick seeing a big price per square foot increase for detached homes in Fredericton and St. John. Elsewhere in Atlantic Canada, home prices by square foot decreased in St. John’s, NL, but remained on par with 2021 – 2022 benchmarks.
In the major city condo markets, the GTA experienced notable decreases, with most markets dipping to prices in line with those in 2022 and downtown Toronto dipping to the lowest level since 2018. Detached homes in the GTA have not been exempted, with Hamilton houses seeing the biggest percentage decrease in the region at 24 per cent. On the west coast, downtown Vancouver condos decreased in price a modest amount, though overall Metro Vancouver prices stepped back to about 2020 – 2021 levels as suburban house prices declined.
Notably, the sales volume in many metropolitan areas trended downward for the first half of this year, likely due to economic uncertainty caused by the tariffs imposed by the US, though many real estate boards report signs of an uptick going into the second half of the year.
Regional highlights:
Atlantic Canada
Markets in Atlantic Canada have been strong this year, especially in the New Brunswick region with Fredericton and St. John both seeing double-digit jumps in their detached home prices per square foot – still to levels below those in most other regions of Canada. Other markets saw more modest gains, and small dips can be observed in Halifax condos and Charlottetown detached homes. However, Halifax retained the jump in pricing seen after the 2021-2022 surge and Charlottetown remains above its 2023 benchmark, though remains one of the most affordable regions in the country.
“It’s definitely been a strong year,” says Krista Trask, agent with CENTURY 21 Sellers Choice in St. John’s, NL. “We’ve been kept busy and we’re seeing a lot of people who are more interested in moving here due to how affordable St. John’s is when compared to the rest of the country.”
“It was a little bit of a slow start in the first quarter, but June had strong numbers,” says Joel Ives with CENTURY 21 Colonial Realty in Charlottetown, PEI. “We had such an increase in the past five years that this year might have pumped the brakes a little and now our market has settled.”
British Columbia
After years of steady upward price growth, BC is seeing the effects of uncertain buyers as both prices and sales volumes dropped. In most cases price declines have been moderate, though detached homes in Burnaby dropped 12 per cent to $791 per square foot and townhouses in Victoria were down 13 per cent to $392 per square foot. Current prices in both cases are still above 2021 levels, after steep increases in 2022 and 2023. In Chilliwack prices have cooled and remained steady after substantial gains since 2020.
In BC’s interior, the pattern of steady pricing continues, with moderate losses and gains. Kelowna saw losses between two to six per cent in all housing types except townhomes, which held steady. As buyers look for cheaper alternatives to the Greater Vancouver area, they might have to go farther outfield – new to the survey this year is Kitimat, which has the lowest PPSF in the country, with townhomes going for $168 per square foot.
Rhiannon Foster, an agent with CENTURY 21 In Town in Vancouver, BC, notes that this year has been a rollercoaster for buyers and sellers in the Lower Mainland. “We started off strong this year, but then came the complications from the tariffs and we saw a pause happen,” she explains. “In my experience, sellers are holding to their prices because they don’t have to sell immediately.
Right now, what I’m seeing is that sales are starting to pick up but we’re about to go into August, when real estate is not a top priority for people. So we’ll see a slowdown over the next few weeks no matter what, but we do expect a lot of inventory to come back in September. If there are sellers waiting, they’ll have competition then.”
Quebec
The price per square foot increases in the Montreal market of years past have continued on an upward trend, with condo prices rising 5 per cent to about the same level as they were in 2022, while detached house prices rose almost eight per cent.
Sebastien Bonnerot, Vice President of CENTURY 21 Quebec in Gatineau, Quebec notes that the price trends in Montreal have settled into a comfortable spot for future growth. “We’re not seeing the big jumps in prices that we saw four to five years ago, but we’ve also moved past that short period of decline that happened around 2023. The market in the Montreal area is strong, we have a lot of young buyers who want a city lifestyle and like the culture and affordability that Montreal has to offer, compared to markets in Ontario.”
Ontario
Ontario, more than any other region of the country, is feeling the most negative effects of the uncertain economic conditions. Condo and house prices in most GTA markets are down, most notably in Toronto proper, where condo prices dipped almost 12 per cent, and in Markham, where detached home prices dropped 22 percent.
Outside of the GTA, pricing changes were more moderate and mixed, with Ottawa emerging as a more popular market and seeing price increases – 22 per cent up for detached houses.
Nelson Goulart, with CENTURY 21 Signature Service, sees how buyers and sellers have hesitated to jump into the market. “They tend to take a position of ‘wait and see,’ similar to the 90’s. There are different factors now, but they’re concerned about qualifying at higher interest rates and once that uncertainly lifts, that’s when they’ll jump in.
“The market has perked up in the last few weeks, and at the end of the day, uncertainty will pass. There may be opportunity now to buy at reduced rates as long as people are looking for long-term investments and looking at the ‘why’ of their decision to purchase a home.”
Prairies
Overall, prices in the prairies were strong compared to the rest of the country. Only condos in Winnipeg fell in price, and then by just 1.5 per cent, while condos in Brandon, Manitoba saw the highest increases – riding 22 per cent in price per square foot. The relative affordability of this region continues to draw buyers looking for more value for their dollar.
Gary Busch, from CENTURY 21 Fusion in Saskatoon, Saskatchewan, notes that his province is the tortoise in the race – no huge changes, but steadily moving forward. “We’re probably going to see a big jump next year,” he notes. “We have jobs, and immigration both from within and outside of Canada. The people who come here are all skilled workers with above-average jobs, with good wages, so we’re building houses as fast as we can, and we have the advantage of still being affordable.”
Alberta
Alberta holds the distinction of being the only region that saw no drops in price per square foot, continuing a strong market trend observed in recent years. There are signs that some of the fervor around Calgary may have cooled – prices rose by less than one per cent – but smaller towns such as High River, Okotoks and Red Deer continued to see increases.
CENTURY 21 Canada’s annual survey of data on the price per square foot (PPSF) of properties gathers and compares sales data from its franchises across Canada from January 1 to June 30 of each year. By looking at the price per square foot at the same time each year the firm is able to get a good idea of how prices have changed over time for similar properties. This year’s survey compares 2024 prices with this year’s results.
Price Per Square Foot Survey Results 2025
| ALBERTA | 2018 | 2019 | 2020 | 2021 | 2022 | 2023 | 2024 | % Change from 2024 | ||
| Calgary | House | $341 | $325 | $320 | $355 | $396 | $419 | $470 | $474 | 0.85% |
| Calgary | Condo | $329 | $317 | $296 | $303 | $326 | $358 | $421 | $422 | 0.24% |
| Edmonton | Detached House | $288 | $272 | $268 | $284 | $297 | $309 | $317 | $341 | 7.57% |
| Edmonton | Duplex | $275 | $256 | $250 | $270 | $287 | $292 | $303 | $316 | 4.29% |
| Edmonton | Condo | $231 | $220 | $206 | $217 | $222 | $204 | $224 | $241 | 7.59% |
| High River | Detached House | $193 | $215 | $237 | $271 | $307 | $334 | $382 | $421 | 10.21% |
| High River | Condo | N/A | $241 | $173 | $176 | $223 | $233 | $285 | $290 | 1.75% |
| Okotoks | Detached House | N/A | $238 | $254 | $283 | $338 | $362 | $394 | $404 | 2.54% |
| Okotoks | Condo | N/A | $254 | $211 | $219 | $251 | $288 | $323 | $371 | 14.86% |
| Red Deer | Detached House | $276 | $262 | $252 | $289 | $293 | $294 | $325 | $359 | 10.46% |
| Red Deer | Townhouse | N/A | N/A | N/A | $207 | $214 | $226 | $222 | $263 | 18.47% |
| St. Albert | Detached House | $287 | $271 | $269 | $289 | $322 | $317 | $322 | $349 | 8.39% |
| St. Albert | Condo | $239 | $223 | $211 | $251 | $238 | $259 | $255 | $273 | 7.06% |
| St. Albert | Duplex | $262 | $272 | $278 | $280 | $325 | $347 | $301 | $336 | 11.63% |
| BRITISH COLUMBIA | 2018 | 2019 | 2020 | 2021 | 2022 | 2023 | 2024 | % Change from 2024 | ||
| Chilliwack | Detached House | $297 | $294 | $288 | $406 | $515 | $419 | $427 | $429 | 0.47% |
| Chilliwack | Townhouse | $267 | $249 | $250 | $318 | $425 | $359 | $379 | $378 | -0.26% |
| Chilliwack | Condo/ Apartment | $283 | $290 | $270 | $351 | $473 | $443 | $437 | $459 | 5.03% |
| Kelowna | Detached House | $283 | $274 | $280 | $368 | $463 | $413 | $417 | $408 | -2.16% |
| Kelowna | Half Duplex | $247 | $260 | $263 | $320 | $402 | $362 | $393 | $366 | -6.87% |
| Kelowna | Townhouse | $292 | $287 | $302 | $365 | $452 | $422 | $422 | $422 | 0.00% |
| Kelowna | Apartment | $345 | $348 | $334 | $411 | $526 | $491 | $482 | $467 | -3.11% |
| Vancouver | Detached House | $856 | $769 | $816 | $975 | $1,177 | $978 | $890 | $860 | -3.37% |
| Vancouver, Downtown | Condo | $856 | $769 | $1,060 | $1,053 | $1,133 | $1,132 | $1,264 | $1,206 | -4.59% |
| Vancouver, East side | Detached House | $721 | $647 | $672 | $877 | $957 | $829 | $977 | $945 | -3.28% |
| Vancouver, West Side | Detached House | $1,147 | $990 | $1,004 | $1,208 | $1,421 | $1,149 | $1,161 | $1,110 | -4.39% |
| Burnaby | Detached House | $599 | $551 | $579 | $688 | $795 | $879 | $900 | $791 | -12.11% |
| West Van | Detached House | $899 | $738 | $734 | $971 | $1,038 | $930 | $1,037 | $958 | -7.62% |
| Vancouver, Richmond | Detached House | $677 | $598 | $608 | $722 | $831 | $773 | $831 | $776 | -6.62% |
| Delta North | Detached House | $423 | $400 | $413 | $570 | $716 | $594 | $618 | $594 | -3.88% |
| North Vancouver | Detached House | $681 | $613 | $690 | $794 | $910 | $817 | $937 | $922 | -1.60% |
| White Rock/South Surrey | Detached House | $506 | $472 | $435 | $625 | $795 | $627 | $724 | $689 | -4.83% |
| Victoria | Detached House | N/A | N/A | N/A | $558 | $592 | $602 | $567 | $577 | 1.76% |
| Victoria | Townhouse | N/A | N/A | N/A | $457 | $583 | $553 | $452 | $392 | -13.27% |
| Victoria | Condo | N/A | N/A | N/A | $659 | $676 | $723 | $694 | $681 | -1.87% |
| Kitimat | Townhouse | $168 | ||||||||
| Kitimat | Detached House | $228 | ||||||||
| ATLANTIC | 2018 | 2019 | 2020 | 2021 | 2022 | 2023 | 2024 | % Change from 2024 | ||
| Charlottetown | Detached House | $147 | $165 | $178 | $211 | $245 | $235 | $252 | $250 | -0.79% |
| Fredericton | Detached House | N/A | $99 | $123 | $147 | $170 | $196 | $196 | $248 | 26.53% |
| Halifax | Detached House | $155 | $162 | $170 | $281 | $408 | $398 | $414 | $436 | 5.31% |
| Halifax | Condo | $228 | $239 | $270 | $291 | $450 | $467 | $467 | $461 | -1.28% |
| Moncton | Detached House | $101 | $106 | $124 | $142 | $173 | $197 | $237 | $244 | 2.95% |
| Saint John | Detached House | N/A | $111 | $123 | $134 | $163 | $192 | $186 | $246 | 32.26% |
| St. John’s | Detached House | N/A | $132 | $135 | $149 | $167 | $167 | $226 | $250 | 10.62% |
| St. John’s | Condo | N/A | $174 | $116 | $182 | $212 | $205 | $310 | $319 | 2.90% |
| PRAIRIES | 2018 | 2019 | 2020 | 2021 | 2022 | 2023 | 2024 | % Change from 2024 | ||
| Regina | Detached House | $254 | $246 | $237 | $250 | $284 | $275 | $290 | $298 | 2.76% |
| Regina | Condo | $236 | $213 | $205 | $205 | $194 | $189 | $227 | $227 | 0.00% |
| Saskatoon | Detached House | $270 | $263 | $263 | $314 | $336 | $344 | $370 | $377 | 1.89% |
| Saskatoon | Condo | $208 | $213 | $217 | $216 | $219 | $226 | $247 | $265 | 7.29% |
| Winnipeg | Detached House | $282 | $243 | $244 | $293 | $315 | $291 | $302 | $328 | 8.61% |
| Winnipeg | Condo | $261 | $220 | $223 | $234 | $254 | $249 | $271 | $267 | -1.48% |
| Winnipeg | Attached | N/A | $202 | $210 | $241 | $269 | $258 | $272 | $288 | 5.88% |
| Brandon | Detached House | $248 | $246 | $248 | $271 | $276 | $276 | $291 | $299 | 2.75% |
| Brandon | Condo | $196 | $204 | $204 | $203 | $243 | $236 | $234 | $269 | 14.96% |
| ONTARIO | 2018 | 2019 | 2020 | 2021 | 2022 | 2023 | 2024 | % Change from 2024 | ||
| Barrie | Detached House | $283 | $350 | $350 | $378 | $503 | $576 | $579 | $600 | 3.63% |
| Bradford | Detached House | $286 | $345 | $358 | $410 | $580 | $535 | $530 | $569 | 7.36% |
| Cambridge | Detached House | $332 | $355 | $388 | $450 | $625 | $568 | $568 | $555 | -2.29% |
| Cambridge | Condo | $344 | $347 | $367 | $435 | $716 | $514 | $530 | $517 | -2.45% |
| Cambridge | Townhouse | $282 | $317 | $341 | $474 | $616 | $490 | $500 | $519 | 3.80% |
| Grey Bruce | Detached House | $175 | $182 | $195 | $357 | $455 | $406 | $415 | $418 | 0.72% |
| Guelph | Detached House | $397 | $409 | $443 | $483 | $690 | $627 | $618 | $633 | 2.43% |
| Guelph | Condo | $374 | $402 | $423 | $511 | $777 | $482 | $480 | $473 | -1.46% |
| Guelph | Duplex | $348 | $362 | $400 | $451 | $648 | $523 | $525 | $547 | 4.19% |
| Guelph | Townhouse | $311 | $335 | $364 | $433 | $641 | $580 | $573 | $470 | -17.98% |
| Hamilton | Detached House | $362 | $378 | $406 | $532 | $553 | $523 | $509 | $385 | -24.36% |
| Hamilton | Townhouse | $257 | $350 | $343 | $453 | $538 | $508 | $507 | $451 | -11.05% |
| Kitchener | Detached House | $339 | $359 | $400 | $430 | $618 | $610 | $605 | $598 | -1.16% |
| Kitchener | Townhouse | N/A | $323 | $342 | $435 | $576 | $487 | $490 | $470 | -4.08% |
| Kitchener | Condo | $328 | $362 | $399 | $483 | $800 | $516 | $491 | $446 | -9.16% |
| London | Detached House | $191 | $237 | $250 | $362 | $466 | $466 | $463 | $475 | 2.59% |
| Markham | Detached House | N/A | N/A | $485 | $557 | $685 | $841 | $822 | $635 | -22.75% |
| Niagara Falls | Detached House | N/A | $275 | $300 | $390 | $531 | $514 | $505 | $503 | -0.40% |
| Newmarket | Detached House | N/A | $372 | $510 | $505 | $516 | $704 | $693 | $570 | -17.75% |
| Ottawa | Detached House | $225 | $258 | $313 | $429 | $465 | $587 | $607 | $741 | 22.08% |
| Ottawa | Townhouse | N/A | N/A | N/A | $392 | $451 | $566 | $534 | $618 | 15.73% |
| Ottawa | Condo | $442 | $485 | $577 | $479 | $583 | $538 | $550 | $594 | 8.00% |
| Owen Sound | Detached House | $145 | $158 | $167 | $312 | $380 | $361 | $362 | $391 | 8.01% |
| Richmond Hill | Detached House | $445 | $465 | $522 | $520 | $665 | $813 | $806 | $647 | -19.73% |
| Sault Ste. Marie | Detached House | $298 | $306 | 2.68% | ||||||
| Sault Ste. Marie | Condo | $328 | $296 | -9.76% | ||||||
| St. Catharines | Detached House | $310 | $290 | $330 | $400 | $612 | $528 | $523 | $567 | 8.41% |
| Toronto, Downtown | Condo | $903 | $994 | $1,083 | $956 | $795 | $739 | $706 | $622 | -11.90% |
| Vaughn | Detached House | $434 | $503 | $548 | $612 | $695 | $772 | $776 | $621 | -19.97% |
| Waterloo | Detached House | N/A | $372 | $407 | $421 | $613 | $603 | $601 | $674 | 12.15% |
| Waterloo | Townhouse | N/A | $324 | $344 | $408 | $641 | $486 | $489 | $531 | 8.59% |
| Waterloo | Condo | N/A | $402 | $411 | $503 | $777 | $525 | $498 | $571 | 14.66% |
| Windsor | Detached House | N/A | $372 | $407 | $295 | $306 | $469 | $364 | $394 | 8.24% |
| QUEBEC | 2018 | 2019 | 2020 | 2021 | 2022 | 2023 | 2024 | % Change from 2024 | ||
| Montreal, Downtown and SW | Condo | $282 | $289 | $431 | $498 | $456 | $439 | $517 | $545 | 5.42% |
| Montreal, Downtown and SW | Detached House | $211 | $222 | $366 | $433 | $500 | $467 | $485 | $523 | 7.84% |
Price Per Square Foot Survey 2024
Canadian home prices largely stable, with some smaller communities, ‘burbs, and AB seeing increases
Annual Price per Square Foot survey looks at prices back to 2018 for almost 50 communities
Vancouver (July 22, 2024) – Canadian housing prices per square foot generally held steady in the first half of this year, with some notable exceptions indicating families continue to migrate to more affordable communities both nearby and across provincial borders.
CENTURY 21 Canada’s eighth annual Price per Square Foot survey compares the price per square foot of properties sold in almost 50 communities between January 1 and June 30 this year to the same period of previous years. In many cases it has data going back to 2018 for both metro centers and smaller communities.
The report reveals that prices in Ontario, BC, and Atlantic Canada remained largely steady this year, with gains in some smaller markets and suburbs while downtown condo prices declined indicating continued migration away from metro cores. Alberta bucked the trend with significant price increases in a number of markets including Calgary and Edmonton – but to prices per square foot still well below those in BC, Quebec, and Ontario. The Prairies also saw price increases, but at a more modest pace.
Major city condo markets outside of Alberta all saw modest dips in price per square foot, while those in Alberta rose – by more than 17 per cent in Calgary and almost 10 per cent in Edmonton. Condo prices in High River topped the increases at more than 22 per cent, but to a relatively affordable $285 a square foot. That compares to $421 in Calgary (up 17.6 per cent), $1,113 in downtown Vancouver (down 1.7 per cent), $706 in downtown Toronto (down 4.5 per cent), and $672 in downtown Montreal (down 11.9 per cent). Vancouver continues to have the highest prices in Canada, while the Prairies and Atlantic Canada have the most affordable.
Looking back over the history of the survey, even with some declines over the last couple of years pricing has not fallen below 2021 levels in any included market. During COVID, 2021 saw significant price surges and set a new benchmark in markets coast-to-coast. For the most part, prices remain well above pre-COVID average.
Sales volumes across Canada have declined from the brisk market of 2021 and 2022, especially in larger cities.
“A number of our brokers are experiencing a slower market when compared to the conditions of just two years ago,” says Todd Shyiak, Executive Vice President of CENTURY 21 Canada. “While across the Prairies and Atlantic provinces the market is quite active and balanced, increasing inventory and hesitant buyers in the GTA and the lower mainland (Vancouver and area) are resulting in a ‘wait and see’ market. With the next possible rate cut coming on July 24th buyers may be extending their ‘wait and see’ approach until the fall.”
Shyiak says that inventory and interest rates will likely be major factors in prices going forward, as sellers may hold off on putting their homes on the market in response to a hesitant buyer base waiting for interest rates to fall.
“Ultimately, we don’t know what the next six months holds for our housing prices, but it’s important not to get too focused on any single year and look at each data point within the larger context of ever-evolving trends. That’s why this survey becomes more valuable year-over-year, because it allows us to see the big picture of Canadian housing.”
Regional highlights:

Atlantic Canada
Prices in Atlantic Canada have continued to see growth, but generally at a far more moderate pace compared to recent years. The sharp rise of Halifax condo prices seen in recent years stopped this year, with no change in price since last year. St. John’s, NL was an exception, with double-digit price growth continuing a steady upward trend that started in 2021. Moncton, NB also bucked this trend with a sharp 20 per cent rise in detached home prices, but to prices per square foot still among the lowest in Canada. Both are smaller markets feeling the boost of immigration both from abroad and within Canada. Along with the Prairies, Atlantic Canada continues to be the most affordable region in Canada, per square foot.
“We’re definitely feeling the change in the market, some areas of the region listing inventory is down while in others it is up. Prices are still trending up at various degrees and there are still families looking to make their home here,” says Joel Ives, Broker at CENTURY 21 Colonial Realty in Charlottetown. “I think we’re going to be able to weather these market conditions because we still have the advantage of affordability compared to the bigger markets.”

British Columbia
Though BC prices were stable overall for the first two-quarters of 2024 several Metro Vancouver suburbs saw price increases while Vancouver condo prices fell modestly, anecdotally due to families continuing to migrate from the city core to more affordable markets that offer more space. Vancouver east side houses went up almost 18 per cent in price to $977 per square foot, a rebound from a price decrease last year and well below the price per square foot of west side and downtown properties. West Vancouver, North Vancouver, Burnaby, Richmond, Delta, White Rock/South Surrey all saw increases this year as well – most of them modest, and a rebound from last year’s declines. Fraser Valley prices were stable.
In BC’s interior Kelowna’s market looks to have finally cooled after years of steady growth going back to 2019. Vernon is new to the report this year, with rates somewhat below those in Kelowna.
“A lot stayed the same this year, and it’s preferable to the alternative,” says CENTURY 21 Creekside owner Cameron Van Klei in Chilliwack. “We’re not seeing any signs of a huge turn, but it has been sluggish and we’re seeing the inevitable slowdown from the boom market of 2021.”

Quebec
After several years of sharp increases Montreal condo prices have declined by approximately 11 per cent. Conversely, detached homes have risen by a similar amount, which could tell a story of younger folks looking to upgrade to more space without moving out of the major metro area.

Ontario
Ontario was largely stable across the board, with the exception of a double-digit drop in Windsor detached house prices. That decrease follows a surge last year, returning the community to prices more in line with 2020 – 2022. The GTA saw little change, with the Toronto downtown condo market dipping by roughly 4.5 per cent. This drop builds on a sharp decline last year.
Sault Ste. Marie is new to the survey this year, and has the lowest PPSF for both condos and detached homes in the province. “We’re excited to see where the results of his survey take us,” says CENTURY 21 Choice Realty owner James Caicco in Sault Ste. Marie. “Our community is growing quickly and we’re sure that year-over-year trends will show just how many people have chosen to make Sault Ste. Marie their home.

Prairies
Overall, prices in the prairies were up in the single digits. Condo prices rose as the larger cities in the region continue to grow, with Regina condos seeing the largest gain at 16 per cent with smaller gains throughout the rest of the province. Only Brandon condos trended downwards, but at a very modest 0.85 per cent. Prairie prices remain among the most affordable in Canada.

Alberta
Alberta bucked the national trend, with prices increasing briskly in numerous markets. Even with the increases Alberta prices remain well below those in neighboring BC, as well as Ontario and Quebec. The price increases tell a story of migration – Canadians moving to Alberta, in particular smaller communities where property prices remain moderate. Calgary prices continue to grow, with young professionals pushing condo prices up 17 per cent from last year.
CENTURY 21 Canada’s annual survey of data on the price per square foot (PPSF) of properties gathers and compares sales data from its franchises across Canada from January 1 to June 30 of each year. By looking at the price per square foot at the same time each year the firm is able to get a good idea of how prices have changed over time for similar properties. This year’s survey compares 2023 prices with this year’s results.
Price Per Square Foot Survey Results 2024
| ALBERTA | HOUSE TYPE | 2018 | 2019 | 2020 | 2021 | 2022 | 2023 | 2024 | % Change from 2023 |
| Calgary | House | $341 | $325 | $320 | $355 | $396 | $419 | $470 | 12.17% |
| Calgary | Condo | $329 | $317 | $296 | $303 | $326 | $358 | $421 | 17.60% |
| Edmonton | Detached House | $288 | $272 | $268 | $284 | $297 | $309 | $317 | 2.59% |
| Edmonton | Duplex | $275 | $256 | $250 | $270 | $287 | $292 | $303 | 3.77% |
| Edmonton | Condo | $231 | $220 | $206 | $217 | $222 | $204 | $224 | 9.80% |
| High River | Detached House | $193 | $215 | $237 | $271 | $307 | $334 | $382 | 14.37% |
| High River | Condo | N/A | $241 | $173 | $176 | $223 | $233 | $285 | 22.32% |
| Okotoks | Detached House | N/A | $238 | $254 | $283 | $338 | $362 | $394 | 8.84% |
| Okotoks | Condo | N/A | $254 | $211 | $219 | $251 | $288 | $323 | 12.15% |
| Red Deer | Detached House | $276 | $262 | $252 | $289 | $293 | $294 | $325 | 10.54% |
| Red Deer | Townhouse | N/A | N/A | N/A | $207 | $214 | $226 | $222 | -1.77% |
| St. Albert | Detached House | $287 | $271 | $269 | $289 | $322 | $317 | $322 | 1.58% |
| St. Albert | Condo | $239 | $223 | $211 | $251 | $238 | $259 | $255 | -1.54% |
| St. Albert | Duplex | $262 | $272 | $278 | $280 | $325 | $347 | $301 | -13.26% |
| BRITISH COLUMBIA | HOUSE TYPE | 2018 | 2019 | 2020 | 2021 | 2022 | 2023 | 2024 | % Change from 2023 |
| Chilliwack | Detached House | $297 | $294 | $288 | $406 | $515 | $419 | $427 | 1.91% |
| Chilliwack | Townhouse | $267 | $249 | $250 | $318 | $425 | $359 | $379 | 5.57% |
| Chilliwack | Condo/ Apartment | $283 | $290 | $270 | $351 | $473 | $443 | $437 | -1.35% |
| Kelowna | Detached House | $283 | $274 | $280 | $368 | $463 | $413 | $417 | 0.97% |
| Kelowna | Half Duplex | $247 | $260 | $263 | $320 | $402 | $362 | $393 | 8.56% |
| Kelowna | Townhouse | $292 | $287 | $302 | $365 | $452 | $422 | $422 | 0.00% |
| Kelowna | Apartment | $345 | $348 | $334 | $411 | $526 | $491 | $482 | -1.83% |
| Vancouver | Detached House | $856 | $769 | $816 | $975 | $1,177 | $978 | $890 | -9.00% |
| Vancouver, Downtown | Condo | $856 | $769 | $1,060 | $1,053 | $1,133 | $1,132 | $1,113 | -1.68% |
| Vancouver, East side | Detached House | $721 | $647 | $672 | $877 | $957 | $829 | $977 | 17.85% |
| Vancouver, West Side | Detached House | $1,147 | $990 | $1,004 | $1,208 | $1,421 | $1,149 | $1,161 | 1.04% |
| Burnaby | Detached House | $599 | $551 | $579 | $688 | $795 | $879 | $900 | 2.39% |
| West Van | Detached House | $899 | $738 | $734 | $971 | $1,038 | $930 | $1,037 | 11.51% |
| Richmond | Detached House | $677 | $598 | $608 | $722 | $831 | $773 | $831 | 7.50% |
| Delta North | Detached House | $423 | $400 | $413 | $570 | $716 | $594 | $618 | 4.04% |
| North Vancouver | Detached House | $681 | $613 | $690 | $794 | $910 | $817 | $937 | 14.69% |
| White Rock/South Surrey | Detached House | $506 | $472 | $435 | $625 | $795 | $627 | $724 | 15.47% |
| Victoria | Detached House | N/A | N/A | N/A | $558 | $592 | $602 | $567 | -5.81% |
| Victoria | Townhouse | N/A | N/A | N/A | $457 | $583 | $553 | $452 | -18.26% |
| Victoria | Condo | N/A | N/A | N/A | $659 | $676 | $723 | $694 | -4.01% |
| ATLANTIC | HOUSE TYPE | 2018 | 2019 | 2020 | 2021 | 2022 | 2023 | 2024 | % Change from 2023 |
| Charlottetown | Detached House | $147 | $165 | $178 | $211 | $245 | $235 | $252 | 7.23% |
| Fredericton | Detached House | N/A | $99 | $123 | $147 | $170 | $196 | $196 | 0.00% |
| Halifax | Detached House | $155 | $162 | $170 | $281 | $408 | $398 | $414 | 4.02% |
| Halifax | Condo | $228 | $239 | $270 | $291 | $450 | $467 | $467 | 0.00% |
| Moncton | Detached House | $101 | $106 | $124 | $142 | $173 | $197 | $237 | 20.30% |
| Saint John | Detached House | N/A | $111 | $123 | $134 | $163 | $192 | $186 | -3.13% |
| St. John’s | Detached House | N/A | $132 | $135 | $149 | $167 | $167 | $272 | 62.87% |
| St. John’s | Condo | N/A | $174 | $116 | $182 | $212 | $205 | $234 | 14.15% |
| PRAIRIES | HOUSE TYPE | 2018 | 2019 | 2020 | 2021 | 2022 | 2023 | 2024 | % Change from 2023 |
| Regina | Detached House | $254 | $246 | $237 | $250 | $284 | $275 | $290 | 5.17% |
| Regina | Condo | $236 | $213 | $205 | $205 | $194 | $189 | $227 | 16.74% |
| Saskatoon | Detached House | $270 | $263 | $263 | $314 | $336 | $344 | $370 | 7.03% |
| Saskatoon | Condo | $208 | $213 | $217 | $216 | $219 | $226 | $247 | 8.50% |
| Winnipeg | Detached House | $282 | $243 | $244 | $293 | $315 | $291 | $302 | 3.64% |
| Winnipeg | Condo | $261 | $220 | $223 | $234 | $254 | $249 | $271 | 8.12% |
| Winnipeg | Attached | N/A | $202 | $210 | $241 | $269 | $258 | $272 | 5.15% |
| Brandon | Detached House | $248 | $246 | $248 | $271 | $276 | $276 | $291 | 5.15% |
| Brandon | Condo | $196 | $204 | $204 | $203 | $243 | $236 | $234 | -0.85% |
| ONTARIO | HOUSE TYPE | 2018 | 2019 | 2020 | 2021 | 2022 | 2023 | 2024 | % Change from 2023 |
| Barrie | Detached House | $283 | $350 | $350 | $378 | $503 | $576 | $579 | 0.52% |
| Bradford | Detached House | $286 | $345 | $358 | $410 | $580 | $535 | $530 | -0.93% |
| Cambridge | Detached House | $332 | $355 | $388 | $450 | $625 | $568 | $568 | 0.00% |
| Cambridge | Condo | $344 | $347 | $367 | $435 | $716 | $514 | $530 | 3.11% |
| Cambridge | Townhouse | $282 | $317 | $341 | $474 | $616 | $490 | $500 | 2.04% |
| Grey Bruce | Detached House | $175 | $182 | $195 | $357 | $455 | $406 | $415 | 2.22% |
| Guelph | Detached House | $397 | $409 | $443 | $483 | $690 | $627 | $618 | -1.44% |
| Guelph | Condo | $374 | $402 | $423 | $511 | $777 | $482 | $480 | -0.41% |
| Guelph | Duplex | $348 | $362 | $400 | $451 | $648 | $523 | $525 | 0.38% |
| Guelph | Townhouse | $311 | $335 | $364 | $433 | $641 | $580 | $573 | -1.21% |
| Hamilton | Detached House | $362 | $378 | $406 | $532 | $553 | $523 | $509 | -2.68% |
| Hamilton | Townhouse | $257 | $350 | $343 | $453 | $538 | $508 | $507 | -0.20% |
| Kitchener | Detached House | $339 | $359 | $400 | $430 | $618 | $610 | $605 | -0.82% |
| Kitchener | Townhouse | N/A | $323 | $342 | $435 | $576 | $487 | $490 | 0.62% |
| Kitchener | Condo | $328 | $362 | $399 | $483 | $800 | $516 | $491 | -4.84% |
| London | Detached House | $191 | $237 | $250 | $362 | $466 | $466 | $463 | -0.64% |
| Markham | Detached House | N/A | N/A | $485 | $557 | $685 | $841 | $822 | -2.26% |
| Niagara Falls | Detached House | N/A | $275 | $300 | $390 | $531 | $514 | $505 | -1.75% |
| Newmarket | Detached House | N/A | $372 | $510 | $505 | $516 | $704 | $693 | -1.56% |
| Ottawa | Detached House | $225 | $258 | $313 | $429 | $465 | $587 | $607 | 3.41% |
| Ottawa | Townhouse | N/A | N/A | N/A | $392 | $451 | $566 | $534 | -5.65% |
| Ottawa | Condo | $442 | $485 | $577 | $479 | $583 | $538 | $550 | 2.23% |
| Owen Sound | Detached House | $145 | $158 | $167 | $312 | $380 | $361 | $362 | 0.28% |
| Richmond Hill | Detached House | $445 | $465 | $522 | $520 | $665 | $813 | $806 | -0.86% |
| Sault Ste. Marie | Detached House | $298 | |||||||
| Sault Ste. Marie | Condo | $328 | |||||||
| St. Catharines | Detached House | $310 | $290 | $330 | $400 | $612 | $528 | $523 | -0.95% |
| Toronto, Downtown | Condo | $903 | $994 | $1,083 | $956 | $1,217 | $739 | $706 | -4.47% |
| Vaughn | Detached House | $434 | $503 | $548 | $612 | $695 | $772 | $776 | 0.52% |
| Waterloo | Detached House | N/A | $372 | $407 | $421 | $613 | $603 | $601 | -0.33% |
| Waterloo | Townhouse | N/A | $324 | $344 | $408 | $641 | $486 | $489 | 0.62% |
| Waterloo | Condo | N/A | $402 | $411 | $503 | $777 | $525 | $498 | -5.14% |
| Windsor | Detached House | N/A | $372 | $407 | $295 | $306 | $469 | $364 | -22.39% |
| QUEBEC | HOUSE TYPE | 2018 | 2019 | 2020 | 2021 | 2022 | 2023 | 2024 | % Change from 2023 |
| Montreal, Downtown and SW | Condo | $567 | $709 | $805 | $935 | $935 | $763 | $672 | -11.93% |
| Montreal, Downtown and SW | Detached House | $603 | $674 | $958 | $1,350 | $1,357 | $880 | $972 | 10.45% |
Règlement NAR illustre l’importance de la pleine transparence dans le processus d’achat d’une maison
Les consommateurs du marché immobilier canadien sont souvent jetés dans le grand bain de la décision financière la plus compliquée de leur vie, et il est crucial qu’ils exigent une transparence totale de l’agent qui est là pour les guider. Le récent règlement de 418 millions de dollars de la National Association of Realtors (NAR) aux États-Unis a entraîné une plus grande complexité dans le processus d’achat de maison aux États-Unis et, bien que les effets ne se soient pas encore fait ressentir au nord, il agit comme un rappel brutal qu’il y a des points clés que les consommateurs devraient discuter avec leurs agents immobiliers dès le départ.
Aux États-Unis, les acheteurs doivent désormais conclure un accord avant de voir une annonce et préciser la rémunération de leur agent. La rémunération de l’agent pourrait maintenant s’ajouter au budget d’achat, il est donc important de comprendre d’où provient la commission de l’agent acheteur – que ce soit du vendeur, de l’agence immobilière mandataire ou de l’acheteur lui-même. Il existe également un potentiel pour plus de transactions “à double extrémité” par des agents mandataires, ce qui soulève des questions sur les avantages pour les consommateurs, surtout lorsqu’il y a eu une poussée précédente dans l’industrie pour limiter ou interdire l’agence double, ce qui n’est actuellement pas autorisé en Colombie-Britannique.
Et avant que nous ne devenions trop complaisants en pensant que le Canada n’a pas à suivre l’exemple de nos voisins du Sud, sachez qu’il existe au moins deux poursuites similaires au Canada concernant des violations de la loi sur la concurrence et des allégations de fixation des prix. La bonne nouvelle est que le Canada a une longue tradition de transparence en ce qui concerne les taux de commission, et bien que les directives en matière de représentation des consommateurs varient d’une province à l’autre, les accords écrits avec les acheteurs sont courants depuis de nombreuses années. Ces accords expliquent souvent les services fournis ainsi que les détails du paiement, et les consommateurs au Canada sont habitués à ce que les services et les coûts leur soient expliqués par leur AGENT IMMOBILIER. Donc, n’ayez pas peur d’avoir une conversation avec votre agent immobilier pour savoir comment les réglementations peuvent impacter et protéger votre processus d’achat de maison.
Pour l’instant cependant, il est crucial de se rappeler que les marchés immobiliers aux États-Unis et au Canada fonctionnent selon leurs règlements distincts et leurs normes industrielles. Bien que le règlement de la NAR puisse ne pas avoir d’impact direct sur les consommateurs canadiens, c’est une occasion pour les acheteurs de maisons préoccupés de planifier des conversations avec leurs agents immobiliers et de savoir exactement comment ils assurent la transparence et priorisent vos intérêts dans les négociations.
Bien que le règlement de la NAR puisse ne pas finir par affecter les pratiques immobilières canadiennes, c’est une chance pour les consommateurs d’être mieux informés. Lorsque vous travaillez avec un agent immobilier, il est essentiel de connaître les bonnes questions à poser dès le départ. Comment fonctionne la rémunération et de qui est la responsabilité? Quels services allez-vous fournir pour le taux de commission que vous recevrez? Comment m’aiderez-vous dans le processus d’achat et/ou de vente? Obtenez une explication sur les règlements immobiliers canadiens et comment votre agent prévoit de prioriser la transparence.
En restant informés et en posant ces questions, les acheteurs de maisons canadiens, en particulier ceux qui se lancent dans une recherche de maison pour la première fois, peuvent naviguer dans ces changements potentiels et s’assurer de prendre des décisions éclairées dans le marché immobilier en constante évolution.

Todd Shyiak, Vice-président exécutif, CENTURY 21 Canada
CENTURY 21 Quantum Realty aims to become a big part of Edmonton real estate

February 26, 2024, Edmonton – One of Edmonton’s top real estate agents has struck out on his own to helm the wheel at his own brokerage. Tushar Bhutani, formerly a RE/MAX agent, has opened the doors of CENTURY 21 Quantum Realty and has big plans for his new path as a brokerage owner.
“I have been in real estate since 2015 and also ranked as one of the top agents in Edmonton for the RE/MAX brand throughout my tenure with them since 2016 to 2023 until I decided to open up my own brokerage and transition myself into C21 brand,” says Tushar. When the time came for him to take his career in a new direction, CENTURY 21 Canada was top of mind and the support he received from the beginning played a large part in his decision to choose the legacy brand as his new home.
“They have such a strong brand presence throughout the province, and I was really impressed by the technology offered to agents to use in their business. The CENTURY 21 Canada team had such a quick response time when I first inquired about opening a C21 franchise, and the support from their management has remained strong to this day.”
Looking to the future, Tushar has big plans to grow his brokerage into a fixture in the Edmonton region. “I want to have the most agents, and the most deals,” he says. “In my past offices and when I was looking for brokerages to work with, I kept finding gaps, especially in supporting agents’ success. Now that I have my own office, I want to implement these systems that will help agents succeed, and I’ve had a great response so far. Now I want to continue this momentum.”
“Tushar has come in with so much enthusiasm and we want to help him every step of the way as he implements his big plans,” says Todd Shyiak, Executive Vice President of CENTURY 21 Canada. “We pride ourselves on standing out amongst Canadian real estate brands because of the level of support we provide our brokers, and they know that our entire head office team is ready to help them succeed.”
A big part of the agent success plan that Tushar envisions is a team atmosphere where every one of his agents can find support and prosper. “I want to hire a mix of new and experienced agents, so that those of different skill levels can find mentorship and support. By thinking of human support first and foremost for my agents, I am sure I will be able to make this office one of the most successful ones with the CENTURY 21 brand.”
CENTURY 21 Quantum Realty opened in December 2023 and already has 13 agents as part of their franchise. Additionally, Tushar Bhutani earned a CENTURION Producer award from the brand for the 2023 fiscal year.
CENTURY 21 Green Realty renews long-term contract with CENTURY 21 Canada

March 2024, Mississauga – CENTURY 21 Green Realty in Mississauga has chosen to renew their contract with CENTURY 21 Canada long-term, continuing a relationship with the legacy brand that has produced numerous accolades and fifteen years of continued success.
Franchise owner Lakhvir Randhawa joined CENTURY 21 Canada in 2009 as the owner of CENTURY 21 Green Realty, and in its first year, the company achieved Gold Medallion® status. The climb over the next decade would see them epitomize excellence and reach Grand CENTURION® status, the highest honour given to offices within the CENTURY 21 Canada system. CENTURY 21 Green Realty has consistently ranked among the top offices in the Global Century 21 network, most recently as the #21 Office by Production in the world for the 2023 fiscal year.
Randhawa has grown his franchise to 265 strong, including agents and support staff. “Our mission is dedicated to being the premier full-service brokerage,” he explains. “We are committed to supporting, empowering, and guiding real estate agents, buyers and sellers alike. Our unwavering focus on providing unparalleled service, expertise, and personalized attention ensures that our agents achieve their business goals with confidence and success.”
CENTURY 21 Green Realty is also the host of an annual golf tournament in support of Easter Seals Canada, the brand’s national charitable partner, which is now looking forward to its seventh outing later this summer.
“A franchise is only as strong as its people, and under Lakhvir’s leadership, the team at CENTURY 21 Green is stronger than ever!” says Todd Shyiak, Executive Vice President of CENTURY 21 Canada. “We are honoured to have supported their growth and watched them come this far, and our entire head office team is looking forward to being there for their journey for many years to come.”
CENTURY 21 Green Realty’s main office serves Mississauga and the broader GTA. They also operate branch and satellite offices in Mississauga and Milton.
How homebuyers can tune out the noise and navigate a difficult housing market

The Mortgage Pre-Qualification Tool by CENTUM Financial Group for CENTURY 21 Canada helps buyers take the first step
It’s no secret that the housing market is currently going through its fair share of ups and downs, and prospective homebuyers are feeling the emotional rollercoaster. Buying a home is one of the biggest financial decisions of your life and many potential homebuyers are quickly overwhelmed.
“There’s no end to the alarmist headlines, from interest rate hikes to inventory stats to endless market analyses,” says Todd Shyiak, executive vice-president of the CENTURY 21 Canada real estate brand. “Naturally, anyone who’s thinking of entering the market is hesitant to make any big moves and we see the ripple effect of that throughout the industry.”
But there are ways for buyers to regain confidence, and a big part of that comes from knowing what they need and what they can afford. Reaching out to a mortgage broker is a good step, but one that a gun-shy buyer may not be ready to take. Still, even if they’re unsure how serious they are about committing to a search, they’ll only benefit from having a hard number to work with. That was the driving factor behind a collaboration between CENTURY 21 Canada and Centum Financial Group, which resulted in their cutting-edge Mortgage Pre-Qualification Tool.
“We realized there wasn’t anything for a consumer to do once they found a listing they liked, but didn’t know if they could afford it,” explains Chris Turcotte, president and CEO of Centum Financial Group. “We wanted them to have a strong idea of what payments they could expect to make and whether or not that fit their lifestyle. That way, when they were ready to reach out to an agent or a mortgage broker, they could have productive conversations and, if necessary, make quick decisions with a high degree of confidence.”
Mortgage pre-qualification isn’t a binding agreement, so if it turns out buyers aren’t ready to take that step, then they’ll have the advantage of a number in the back of their mind whenever they decide to return to that search. And as interest rates fluctuate or more inventory comes into the housing market, having concrete information will stave off the stress that comes from doomsday headlines or the next analyst trying to predict the future.
“At the end of the day, we can only make informed predictions about what the housing market will do, but we can’t make any guarantees,” says Turcotte. “If you’re in the market for a new home, take the time to know your numbers and take control where you can — more preparation means less stress in the long run.”
To search for listings and try out the Mortgage Pre-Qualification Tool, visit c21.ca.
CENTURY 21 Canada Opens 18 New Offices in 2023

January 19, 2023, Vancouver- CENTURY 21 Canada ended 2023 on a high-note with a total of 18 new offices opening across the country.
“We didn’t know how the year was going to go, but we stood by our value proposition and once again, brokers responded,” says Todd Shyiak, Executive Vice President of CENTURY 21 Canada. “As the real estate market in Canada comes down from the high of the past few years, more and more brokers are seeing the value in the training, tech and personal support that we aim to provide each and every one of them. Our team is the best in the business and there’s nothing we haven’t experienced, so if one of our brokers needs a word of advice, we’re here for them.”
New Franchises and Offices
| CENTURY 21 Smart Realty | Edmonton, AB |
| CENTURY 21 Twin Realty | Hinton, AB |
| CENTURY 21 River’s Edge Ltd. | Winchester, ON |
| CENTURY 21 Shield Realty Ltd. | Lancaster, ON |
| CENTURY 21 Property Zone Realty Inc. | Brampton, ON |
| CENTURY 21 Percy Fulton Ltd. | Brighton, ON |
| CENTURY 21 Green Realty Inc. | Mississauga, ON |
| CENTURY 21 Creekside Realty Ltd. | Chilliwack, BC
Chilliwack, BC |
| CENTURY 21 Creekside Realty Ltd. | Agassiz, BC |
| CENTURY 21 Creekside Realty Ltd. | Abbotsford, BC |
| CENTURY 21 Gillany Realty | Whitecourt, AB |
| CENTURY 21 Northern Realty | Vaughan, ON |
| CENTURY 21 Quantum Realty | Edmonton, AB |
| CENTURY 21 Trident Realty Ltd. | North Sydney, NS |
| CENTURY 21 ACE | Calgary, AB |
| CENTURY 21 Profusion | Montreal, QC |
| CENTURY 21 Power Realty Ltd. | Calgary, AB |
Owner of CENTURY 21 Gillany Realty, Rizwan Sayed, has seen the advances in real estate technology and created an innovative space for agents under the CENTURY 21 Canada brand. “I had heard great reviews of the brand, and I liked that they innovate,” says Sayed. “They are constantly looking for ways to improve and evolve, they provide a full suite of technology tools to help us push forward and the physical human support I get from the head office has no equal in the industry.”
Vikaas K. Kwatra opened the first office of 2023 in Edmonton, CENTURY 21 Smart Realty. “My main motivation is to help new agents because if they don’t have the right teacher, they leave within six months of joining the industry,” he explains. “I was with the brand for a long time and when I wanted to open my own brokerage, my experiences with their tools, culture and support system made them better than anyone.”
CENTURY 21 Canada now boasts approximately 400 offices across Canada and, in addition to its new franchises, renewed contracts with 26 brokerages in 2023.
Price Per Square Foot Survey 2023
Interest rate hikes prompt modest decline in Canadian home prices, but no freefall in sight, impact uneven
Vancouver (Aug 2, 2022) – Canadian housing prices have fallen with rising interest rates, but when looking back over even just two years remain on a long-term upward trend. Even then, the situation is uneven. The hot housing markets of the biggest city centres are seeing lower condo prices but smaller markets are seeing price per square foot growth, especially in single-family homes. Alberta bucked the trend and experienced price increases in many markets this year, while other Prairie provinces held steady. BC saw the most significant price declines.
The seventh annual Price per Square Foot survey is being released by CENTURY 21 Canada, comparing the price per square foot of properties sold between January 1 and June 30 this year to the same period of previous years.
Notably, most markets that did experience price declines from last year remained roughly equivalent to their 2021 benchmarks and well above earlier years. This year’s survey offers data going back to 2018 for numerous communities coast-to-coast.
“We knew that the market had to come down from the highs of the last few years, and we’re now fully seeing the effects of the interest rate growth that started last year,” says Todd Shyiak, Executive Vice President of CENTURY 21 Canada. “But we have to look at these numbers within the larger context. The fact that we haven’t dipped to pre-pandemic levels shows that homes are still in demand, and we continue to see growth in smaller markets as more families seek a lower cost of living.”
Prices had reached low points in January but steadily climbed over the spring, though many markets didn’t manage to regain their 2022 levels. Condos in Vancouver, Toronto and Montreal all saw declines, while detached homes across small Ontario cities rose, as did those in Atlantic Canada, indicating families seeking space. New Brunswick is emerging as a leader in Atlantic Canadian growth. Results from the 2021 census showed that Moncton, Fredericton and St. John are seen as popular locations for immigrants, and the results from this year’s PPSF survey indicate that trend has continued.
Shyiak says that inventory will play a major factor in prices going forward, as sellers may hold off on putting their homes on the market in response to a hesitant buyer base. “Ultimately, we don’t know what the next six months holds for our housing prices, but it’s important not to get too focused on any single year and look at each data point within the larger context of ever evolving trends. That’s why this survey becomes more valuable year-over-year, because it allows us to see the big picture of Canadian housing.”
Regional highlights:

Atlantic Canada
Prices in Atlantic Canada have continued to rise as Canadians from expensive urban markets seek a lower cost of living. For the first year since this survey started Halifax has lost its crown as the market with the steepest rise as condos in that city saw the smallest increase in the region after a sharp double-digit increase last year. Detached homes in Fredericton, Moncton and St. John’s all saw double-digit increases.
“Families are finding this to be a great place to settle down. We’ve been seeing these trends for years but post-2020 is when it really took off,” says Paul Burns, Manager at CENTURY 21 A&T Countryside Realty. “Interest rates may have slowed the market down slightly, but I’m confident New Brunswick especially will continue to grow.”

British Columbia
The steep prices throughout BC seem to have finally reached their cooling point, with the province seeing the steepest price declines but generally to levels still at or above those from 2021. Even then, Vancouver boasts some of the most expensive price per square foot dwellings in Canada, and prices of both detached houses and condos in the surrounding suburbs remain comparatively high.
Cities farther from the metropolitan core such as Chilliwack and Kelowna have also seen dips, though prices climbed throughout the spring to remain above 2021 levels. The only BC region to see growth was Victoria, possibly indicating more Lower Mainlanders searching across the water for cheaper real estate.

Quebec
Like the other Canadian metropolises, Montreal saw a dip in the price of condos and detached homes, but unlike Vancouver and Toronto the decline was modest and in the single digits. “A lot of young buyers like Montreal, and that’s helped keep the markets here relatively stable,” says Mohamad Al-Hajj, owner of CENTURY 21 Immo-Plus. “We’ll keep an eye on how the rest of the year goes, but it does look like things will remain steady.”
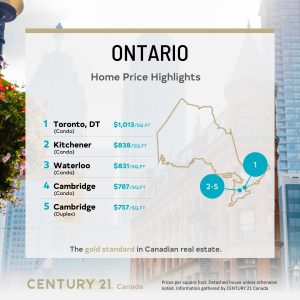
Ontario
Canada’s most populous province saw a wide range of change throughout, from declines to rises all over the map. Toronto condos remain expensive at a PPSF of $1,013, though this is a 16 per cent drop from 2022 to a level roughly in line with 2021 and 2020 prices. However, cities like Niagara Falls and Cambridge saw their family home types gain in the double-digits, and they lead an overall trend of cities farther away from the GTA seeing growth in the price of single-family homes.
“The trend of families looking for space away from the downtown core continues,” says Eryn Richardson, owner of CENTURY 21 Heritage Group. “The changing interest rates definitely had an impact on the prices as buyers are more hesitant, but no single market has fallen dramatically and we’re still seeing a lot of growth.”

Prairies
The Prairies have remained relatively steady with minor gains and losses across the board. Saskatoon detached homes lead the pack at a PPSF of $344, a testament to families who come to the region for space and lower costs. Winnipeg, Brandon and Regina continue the trend, seeing their detached single family homes at $291, $276 and $275 respectively. The most significant decline was in Winnipeg, but even there detached homes fell just 7.62 per cent in price per square foot – the moderate change reflecting the stability of the region.

Alberta
Overall, Alberta has seen the most growth over the past year, with consistent price per square foot gains in most markets. Growth was modest but steady over the first half of 2023, and regions that saw declines dipped no further than 2020 levels. Edmonton condos were among those to decline, a potential sign of younger and newer buyers being affected by rising interest rates.
However, condos in Okotoks rose 14 per cent in price, a good indication that smaller towns still have the potential to grow fast as buyers explore new options. Just north, Calgary saw a rise of 5.81 per cent in single-family homes and 9.82 per cent in condos, while Red Deer was largely unchanged.
“Alberta has really emerged as a viable option for a lot of buyers who are leaving the more expensive areas of BC. Buyers both young and established are finding homes that fit their needs,” says George Bamber, owner of CENTURY 21 Bamber Realty. “Not only are they getting cheaper housing, but they’re also finding vibrant and fast-growing communities that they can make their own.”
CENTURY 21 Canada’s annual survey of data on the price per square foot (PPSF) of properties gathers and compares sales data from its franchises across Canada from January 1 to June 30 of each year. By looking at the price per square foot at the same time each year the firm is able to get a good idea of how prices have changed over time for similar properties. This year’s survey compares 2022 prices with this year’s results.
See the full PPSF study results below.
| ALBERTA | House Type | 2018 | 2019 | 2020 | 2021 | 2022 | 2023 | % Change from 2022 |
| Calgary | House | $341 | $325 | $320 | $355 | $396 | $419 | 5.81% |
| Calgary | Condo | $329 | $317 | $296 | $303 | $326 | $358 | 9.82% |
| Edmonton | Detached House | $288 | $272 | $268 | $284 | $297 | $309 | 4.04% |
| Edmonton | Duplex | $275 | $256 | $250 | $270 | $287 | $292 | 1.74% |
| Edmonton | Condo | $231 | $220 | $206 | $217 | $222 | $204 | -8.11% |
| High River | Detached House | $193 | $215 | $237 | $271 | $307 | $334 | 8.79% |
| High River | Condo | N/A | $241 | $173 | $176 | $223 | $233 | 4.48% |
| Okotoks | Detached House | N/A | $238 | $254 | $283 | $338 | $362 | 7.10% |
| Okotoks | Condo | N/A | $254 | $211 | $219 | $251 | $288 | 14.74% |
| Red Deer | Detached House | $276 | $262 | $252 | $289 | $293 | $294 | 0.34% |
| Red Deer | Townhouse | N/A | N/A | N/A | $207 | $214 | $226 | 5.61% |
| Red Deer | Condo | N/A | N/A | N/A | $186 | $194 | $196 | 1.03% |
| Red Deer | Duplex | N/A | N/A | N/A | N/A | $269 | $264 | -1.86% |
| St. Albert | Detached House | $287 | $271 | $269 | $289 | $322 | $317 | -1.55% |
| St. Albert | Condo | $239 | $223 | $211 | $251 | $238 | $259 | 8.82% |
| St. Albert | Duplex | $262 | $272 | $278 | $280 | $325 | $347 | 6.77% |
| BRITISH COLUMBIA | House Type | 2018 | 2019 | 2020 | 2021 | 2022 | 2023 | % Change from 2022 |
| Chilliwack | Detached House | $297 | $294 | $288 | $406 | $515 | $419 | -18.64% |
| Chilliwack | Townhouse | $267 | $249 | $250 | $318 | $425 | $359 | -15.53% |
| Chilliwack | Condo/ Apartment | $283 | $290 | $270 | $351 | $473 | $443 | -6.34% |
| Kelowna | Detached House | $283 | $274 | $280 | $368 | $463 | $413 | -10.80% |
| Kelowna | Half Duplex | $247 | $260 | $263 | $320 | $402 | $362 | -9.95% |
| Kelowna | Townhouse | $292 | $287 | $302 | $365 | $452 | $422 | -6.64% |
| Kelowna | Apartment | $345 | $348 | $334 | $411 | $526 | $491 | -6.65% |
| Vancouver | Detached House | $856 | $769 | $816 | $975 | $1,177 | $978 | -16.91% |
| Vancouver, Downtown | Condo | $856 | $769 | $1,060 | $1,053 | $1,133 | $1,132 | -0.09% |
| Vancouver, East side | Detached House | $721 | $647 | $672 | $877 | $957 | $829 | -13.38% |
| Vancouver, West Side | Detached House | $1,147 | $990 | $1,004 | $1,208 | $1,421 | $1,149 | -19.14% |
| Burnaby | Detached House | $599 | $551 | $579 | $688 | $795 | $725 | -8.81% |
| West Van | Detached House | $899 | $738 | $734 | $971 | $1,038 | $930 | -10.40% |
| Vancouver, Richmond | Detached House | $677 | $598 | $608 | $722 | $831 | $773 | -6.98% |
| Delta North | Detached House | $423 | $400 | $413 | $570 | $716 | $594 | -17.04% |
| North Vancouver | Detached House | $681 | $613 | $690 | $794 | $910 | $817 | -10.22% |
| White Rock/South Surrey | Detached House | $506 | $472 | $435 | $625 | $795 | $627 | -21.13% |
| Victoria | Detached House | N/A | N/A | N/A | $558 | $592 | $602 | 1.69% |
| Victoria | Townhouse | N/A | N/A | N/A | $457 | $583 | $553 | -5.15% |
| Victoria | Condo | N/A | N/A | N/A | $659 | $676 | $723 | 6.95% |
| ATLANTIC | House Type | 2018 | 2019 | 2020 | 2021 | 2022 | 2023 | % Change from 2022 |
| Charlottetown | Detached House | $147 | $165 | $178 | $211 | $245 | $235 | -4.08% |
| Fredericton | Detached House | N/A | $99 | $123 | $147 | $170 | $196 | 15.29% |
| Halifax | Detached House | $155 | $162 | $170 | $281 | $408 | $398 | -2.45% |
| Halifax | Condo | $228 | $239 | $270 | $291 | $450 | $467 | 3.78% |
| Moncton | Detached House | $101 | $106 | $124 | $142 | $173 | $197 | 13.87% |
| Saint John | Detached House | N/A | $111 | $123 | $134 | $163 | $192 | 17.79% |
| St. John’s | Detached House | N/A | $132 | $135 | $149 | $167 | $167 | 0.00% |
| St. John’s | Condo | N/A | $174 | $116 | $182 | $212 | $205 | -3.30% |
| PRAIRIES | House Type | 2018 | 2019 | 2020 | 2021 | 2022 | 2023 | % Change from 2022 |
| Regina | Detached House | $254 | $246 | $237 | $250 | $284 | $275 | -3.17% |
| Regina | Condo | $236 | $213 | $205 | $205 | $194 | $189 | -2.58% |
| Saskatoon | Detached House | $270 | $263 | $263 | $314 | $336 | $344 | 2.38% |
| Saskatoon | Condo | $208 | $213 | $217 | $216 | $219 | $226 | 3.20% |
| Winnipeg | Detached House | $282 | $243 | $244 | $293 | $315 | $291 | -7.62% |
| Winnipeg | Condo | $261 | $220 | $223 | $234 | $254 | $249 | -1.97% |
| Winnipeg | Attached | N/A | $202 | $210 | $241 | $269 | $258 | -4.09% |
| Brandon | Detached House | $248 | $246 | $248 | $271 | $276 | $276 | 0.00% |
| Brandon | Condo | $196 | $204 | $204 | $203 | $243 | $236 | -2.88% |
| ONTARIO | House Type | 2018 | 2019 | 2020 | 2021 | 2022 | 2023 | % Change from 2022 |
| Barrie | Detached House | $283 | $350 | $350 | $378 | $503 | $524 | 4.17% |
| Bradford | Detached House | $286 | $345 | $358 | $410 | $580 | $617 | 6.38% |
| Cambridge | Detached House | $332 | $355 | $388 | $450 | $625 | $670 | 7.20% |
| Cambridge | Duplex | $311 | $331 | $377 | $527 | $656 | $757 | 15.40% |
| Cambridge | Condo | $344 | $347 | $367 | $435 | $716 | $787 | 9.92% |
| Cambridge | Townhouse | $282 | $317 | $341 | $474 | $616 | $575 | -6.66% |
| Grey Bruce | Detached House | $175 | $182 | $195 | $357 | $455 | $434 | -4.62% |
| Guelph | Detached House | $397 | $409 | $443 | $483 | $690 | $527 | -23.62% |
| Guelph | Condo | $374 | $402 | $423 | $511 | $777 | $740 | -4.76% |
| Guelph | Duplex | $348 | $362 | $400 | $451 | $648 | $691 | 6.64% |
| Guelph | Townhouse | $311 | $335 | $364 | $433 | $641 | $605 | -5.62% |
| Hamilton | Detached House | $362 | $378 | $406 | $532 | $553 | $530 | -4.16% |
| Hamilton | Townhouse | $257 | $350 | $343 | $453 | $538 | $482 | -10.41% |
| Kitchener | Detached House | $339 | $359 | $400 | $430 | $618 | $610 | -1.29% |
| Kitchener | Semi-Detached | N/A | $341 | $399 | $460 | $623 | $632 | 1.44% |
| Kitchener | Townhouse | N/A | $323 | $342 | $435 | $576 | $583 | 1.22% |
| Kitchener | Condo | $328 | $362 | $399 | $483 | $800 | $838 | 4.75% |
| London | Detached House | $191 | $237 | $250 | $362 | $466 | $384 | -17.60% |
| Markham | Detached House | N/A | N/A | $485 | $557 | $685 | $753 | 9.93% |
| Niagara Falls | Bungalow | N/A | $336 | $395 | $475 | $630 | $746 | 18.41% |
| Niagara Falls | Detached House | N/A | $275 | $300 | $390 | $531 | $606 | 14.12% |
| Newmarket | Detached House | N/A | $372 | $510 | $505 | $516 | $536 | 3.88% |
| Ottawa | Detached House | $225 | $258 | $313 | $429 | $465 | $502 | 7.96% |
| Ottawa | Townhouse | N/A | N/A | N/A | $392 | $451 | $419 | -7.10% |
| Ottawa | Condo | $442 | $485 | $577 | $479 | $583 | $552 | -5.32% |
| Owen Sound | Detached House | $145 | $158 | $167 | $312 | $380 | $393 | 3.42% |
| Richmond Hill | Detached House | $445 | $465 | $522 | $520 | $665 | $717 | 7.82% |
| St. Catharines | Bungalow | $385 | $367 | $425 | $520 | $589 | $639 | 8.49% |
| St. Catharines | Detached House | $310 | $290 | $330 | $400 | $612 | $636 | 3.92% |
| Toronto, Downtown | Condo | $903 | $994 | $1,083 | $956 | $1,217 | $1,013 | -16.76% |
| Vaughn | Detached House | $434 | $503 | $548 | $612 | $695 | $687 | -1.15% |
| Waterloo | Detached House | N/A | $372 | $407 | $421 | $613 | $520 | -15.17% |
| Waterloo | Semi-detached | N/A | $357 | $399 | $439 | $648 | $663 | 2.31% |
| Waterloo | Townhouse | N/A | $324 | $344 | $408 | $641 | $651 | 1.56% |
| Waterloo | Condo | N/A | $402 | $411 | $503 | $777 | $831 | 6.95% |
| Windsor | Detached House | N/A | $372 | $407 | $295 | $306 | $469 | 53.27% |
| QUEBEC | House Type | 2018 | 2019 | 2020 | 2021 | 2022 | 2023 | % Change from 2022 |
| Montreal, Downtown and SW | Condo | $567 | $709 | $805 | $935 | $935 | $879 | -5.99% |
| Montreal, Downtown and SW | Detached House | $603 | $674 | $958 | $1,350 | $1,357 | $1,235 | -8.99% |

