Facebook
 X
X
 Pinterest
 Copy Link

Canadian home prices remain soft – but the story varies significantly outside big metropolitan centers
Annual Price per Square Foot survey looks at prices during a volatile period for Canadian real estate
Vancouver (July 28, 2026) – While Canadian home prices declined overall in the first half this year, the story gets widely variable when you look deeper, down to the local level. While Vancouver condo prices declined almost 15 per cent in the first half of the year and Toronto condos almost eight per cent, the price of a detached house in Regina, Saskatchewan, surged 13 per cent – though to a price per square foot still well under half that of a Vancouver or Toronto condo.
CENTURY 21 Canada’s ninth annual Price per Square Foot survey compares the price per square foot of properties sold in 50 communities between January 1 and June 30 this year to the same period of previous years. This year, the survey added the communities of Mississauga in Ontario and Surrey, Abbotsford and Langley in BC.
“While overall the real estate market has been soft this year, Canada’s real estate pricing story is a diverse one and we are seeing significant variation in prices, and price trends, down to the individual neighbourhood,” says Todd Shyiak, Executive Vice President of CENTURY 21 Canada. “The data tells a story of people continuing to move from big city cores in favour of larger communities where you can get more home for your dollar, while pricing in the Prairies and, to a lesser extent, Alberta and Atlantic Canada remain stronger.”
In regions where prices are down overall, a few markets still remain brisk. In BC, for example, some larger markets outside Vancouver proper, like Chilliwack and Kelowna, were steady – though even with substantial price declines Vancouver condos and west side houses remain the most expensive properties in Canada. Toronto and the GTA were down across the board, though Hamilton was up a bit, while declines in Atlantic Canada were modest with Charlottetown showing a slight increase.
A lack of inventory was a key driver of Ontario’s slower market, as people held off putting their homes up for sale.
“Many of our brokers in Ontario are reporting the tightest market most of their agents have seen in their careers,” says Shyiak. “The lack of inventory and uncertainty from buyers as they remain in ‘wait-and-see’ mode are driving a challenging climate. That said, if you look back over a decade, overall prices have trended up over time, which we hope will give consumers confidence to get into the market when they’re ready.”
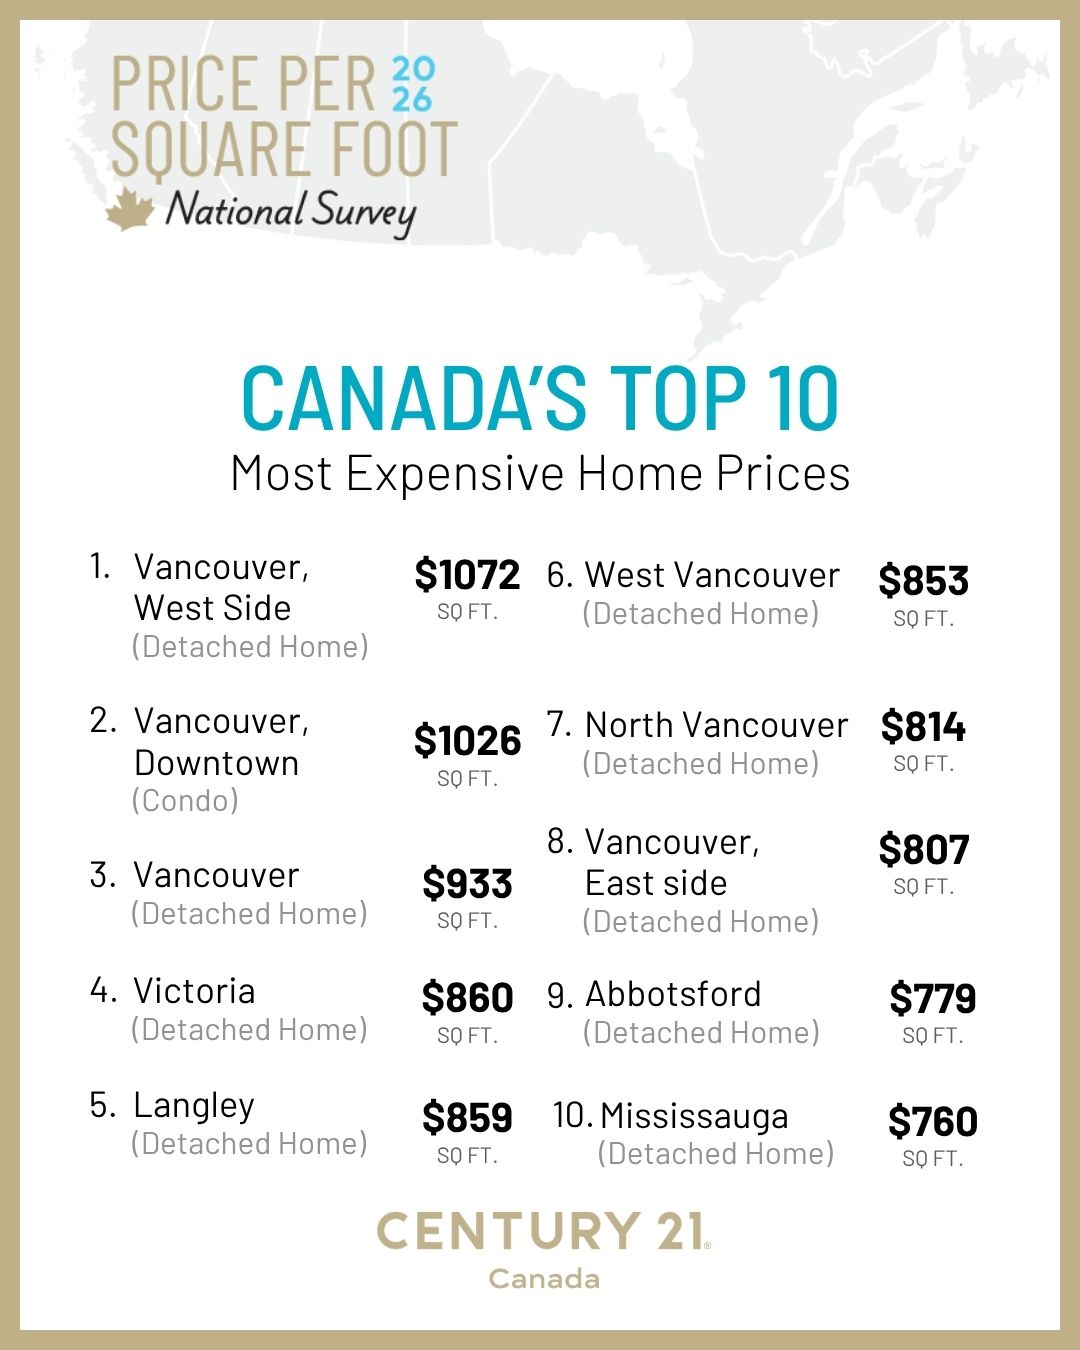
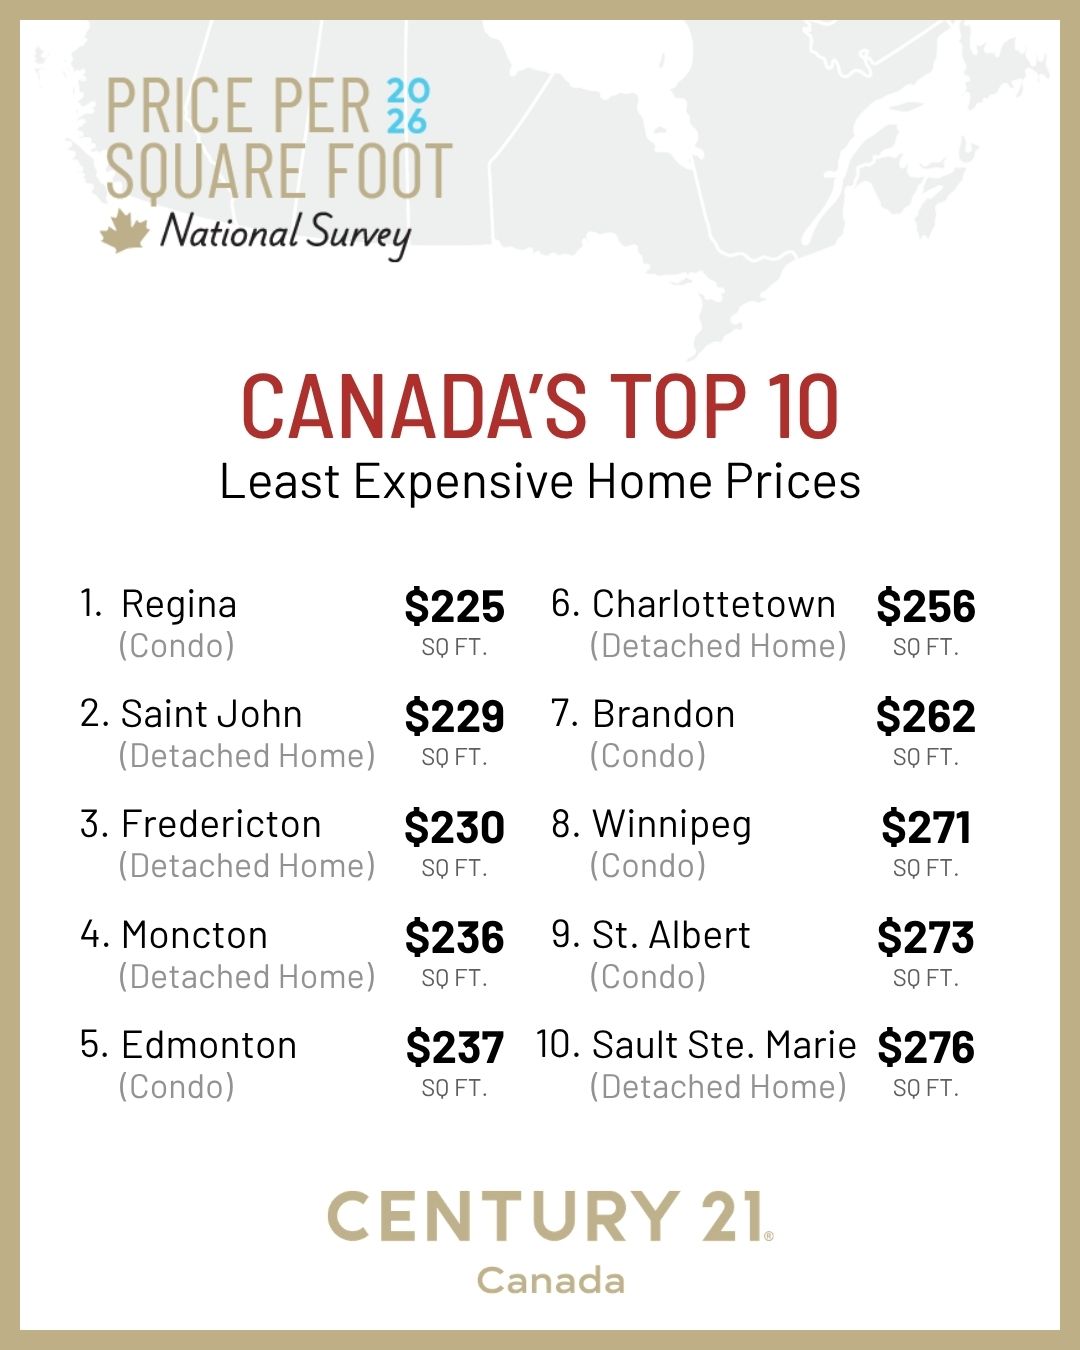
Regional highlights:
Atlantic Canada
While markets in Atlantic Canada generally saw modest declines this year, with some exceptions, prices were generally stable – a trend consistent with the past few years. All declines stayed under 10 per cent, with small price increases in Charlottetown and Halifax.
“We’re seeing stabilization, but also a little bit of apprehension,” says Joel Ives, owner of CENTURY 21 Colonial Realty in Charlottetown, PEI. “As people are dealing with rising cost of living, not as many buyers are looking to move up from their starter home, and owners in those larger properties aren’t downsizing right now, so we’re sitting at a bit of a stalemate.”
Looking towards the rest of the year, Ives foresees more of the same, though the possibility for pickup isn’t entirely out of the question. “Unless there are some major changes to the economy then I think everyone is sitting back and waiting. But we’ve been through that in the past, when after a bottleneck, everything just goes full tilt again. It’s hard to have a happy medium.”
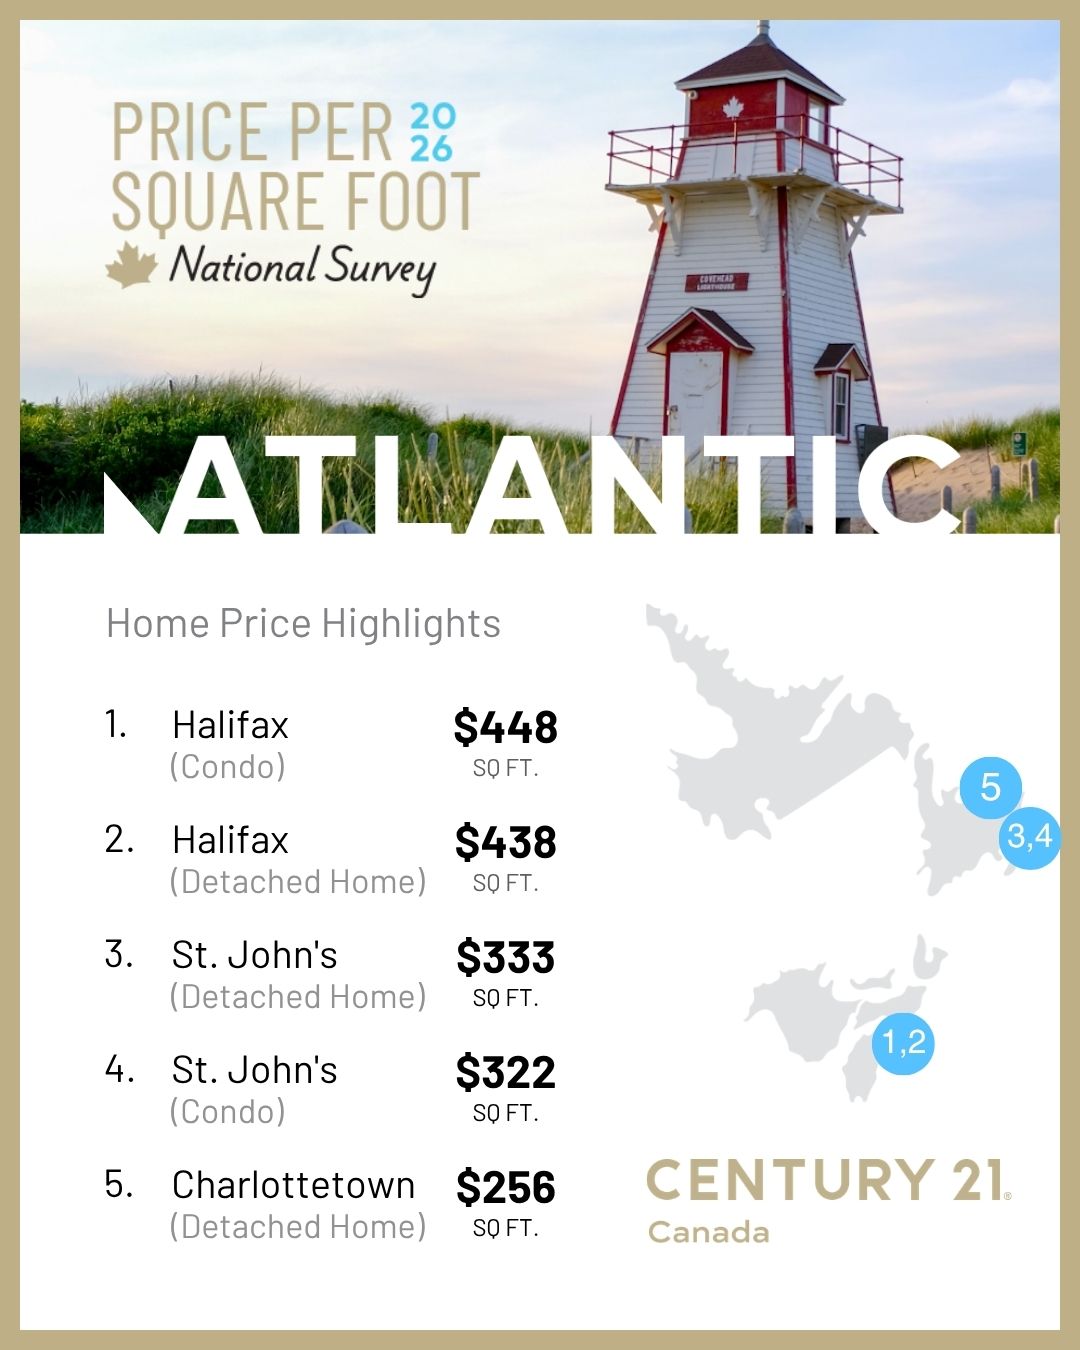
British Columbia
Though BC boasts some of the highest prices per square foot in Canada, the province is not immune to the effects of a slower economy. Uncertain buyers have driven down the prices by nearly 15 per cent in Vancouver’s condo and detached homes market, with nearby suburbs of Richmond, North Vancouver, and White Rock seeing declines of about 10 per cent. That said, these declines follow a few years of steep increases, and generally speaking prices in those communities have returned to pre-pandemic levels.
Some larger communities farther away from the core, such as Kelowna and Chilliwack, however, remained comparatively steady in this year’s period. Prices in Kelowna and Victoria were essentially flat. While prices are down somewhat in Chilliwack, the city’s price stability stands out when compared to Metro Vancouver cities or even among the surrounding communities in the Fraser Valley, which saw drops of up to nine per cent according to external market statistics (not reflected in this year’s survey).
According to local real estate agents, even in markets seeing price declines, good homes that are realistically priced are still moving well.
“What we’re seeing is that good product coming onto the market is still being bought up quickly,” says Rhiannon Foster, agent with CENTURY 21 In-Town Realty, based in Vancouver. “For buyers that have been waiting, this might be the best environment for them – they have choice, they have time to make decisions, they have negotiating power that hasn’t been possible in a very long time.”
The recent government announcement regarding the purchase of unsold condo inventory may not have as big of an impact as one might expect. “The purchase will obviously have an impact on developers and possibly free up some of their capital for other projects,” Foster says. “But for resale buyers, I don’t expect that announcement to dramatically change the market conditions, and the big driver will continue to be affordability.”
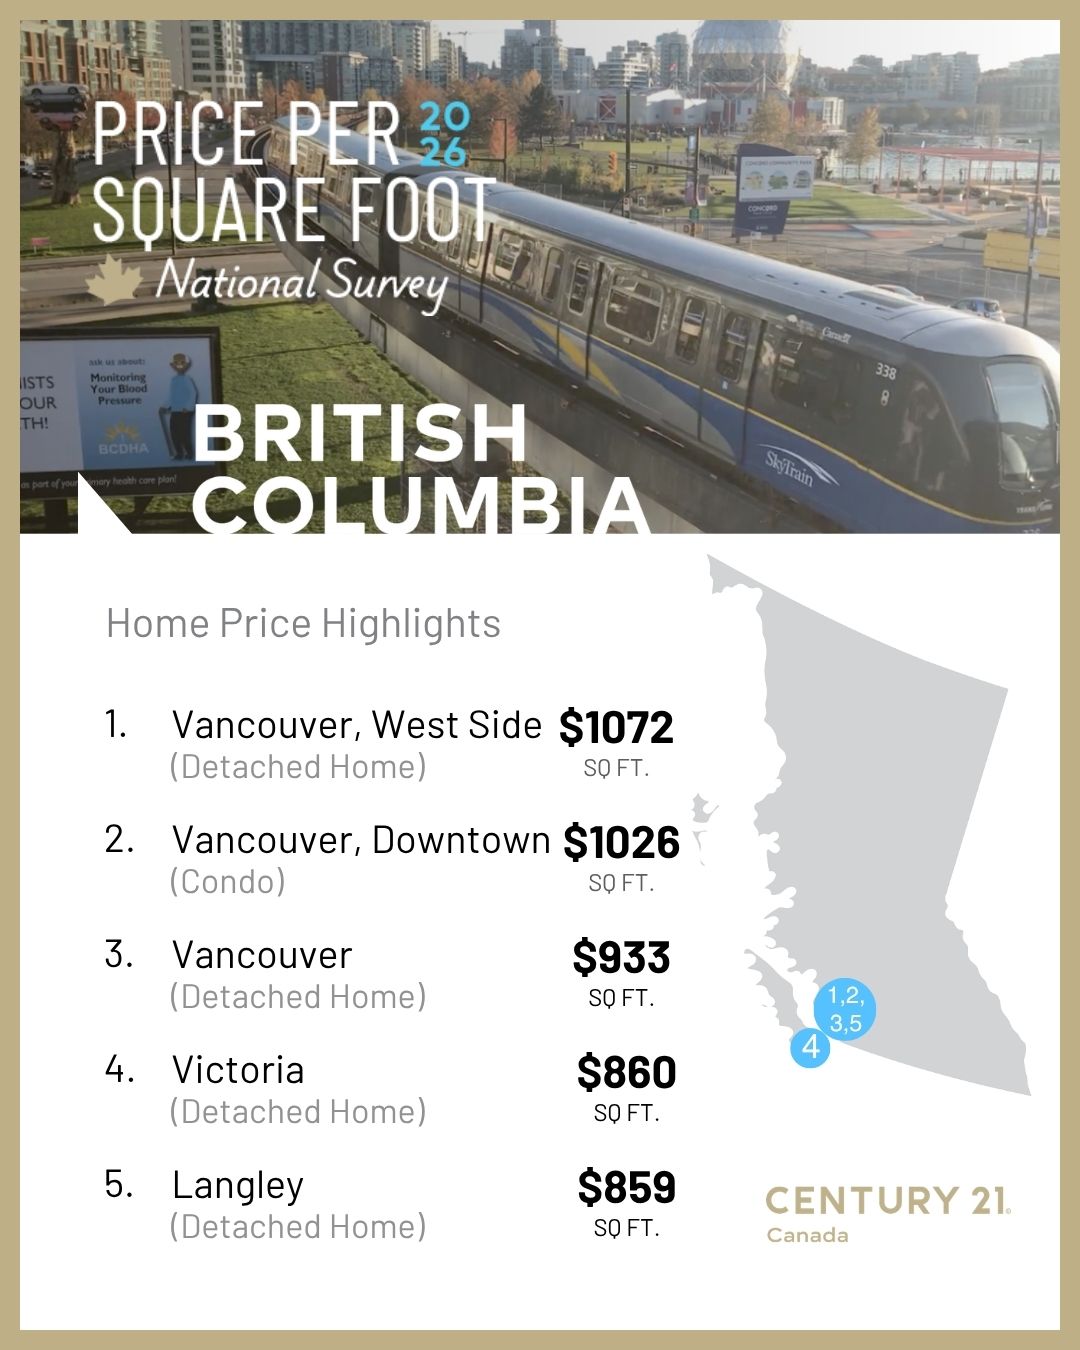
Quebec
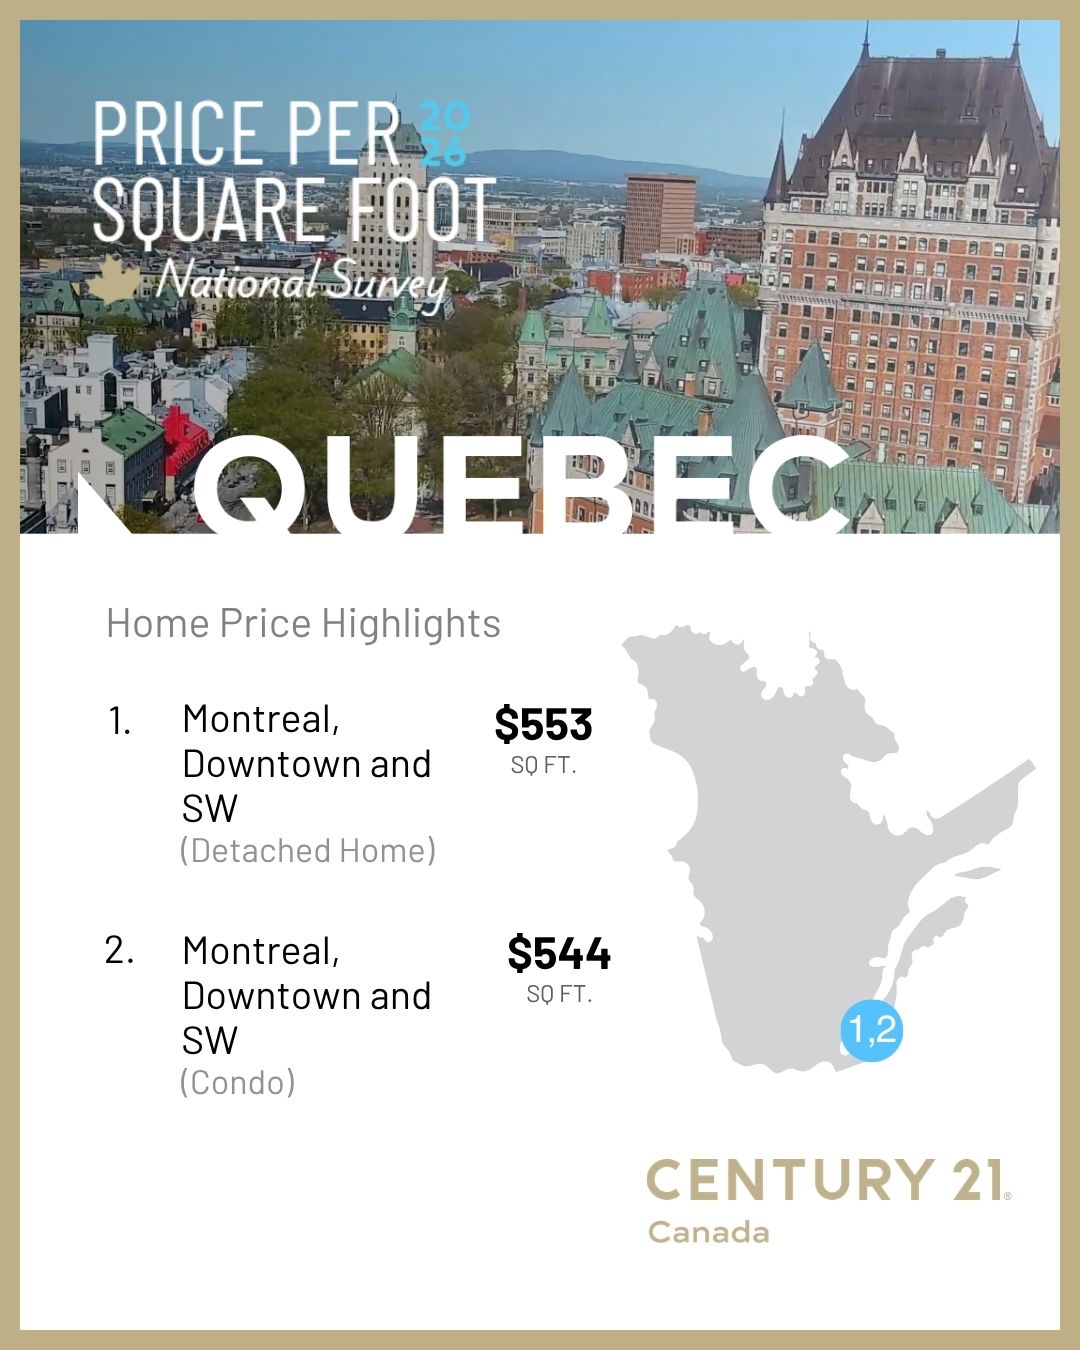
The Island of Montreal has retained its stability after several years of big price jumps. For the first year since the survey began, Montreal condos have seen a dip (albeit very minor). Meanwhile, detached homes have risen nearly six per cent.
Ontario
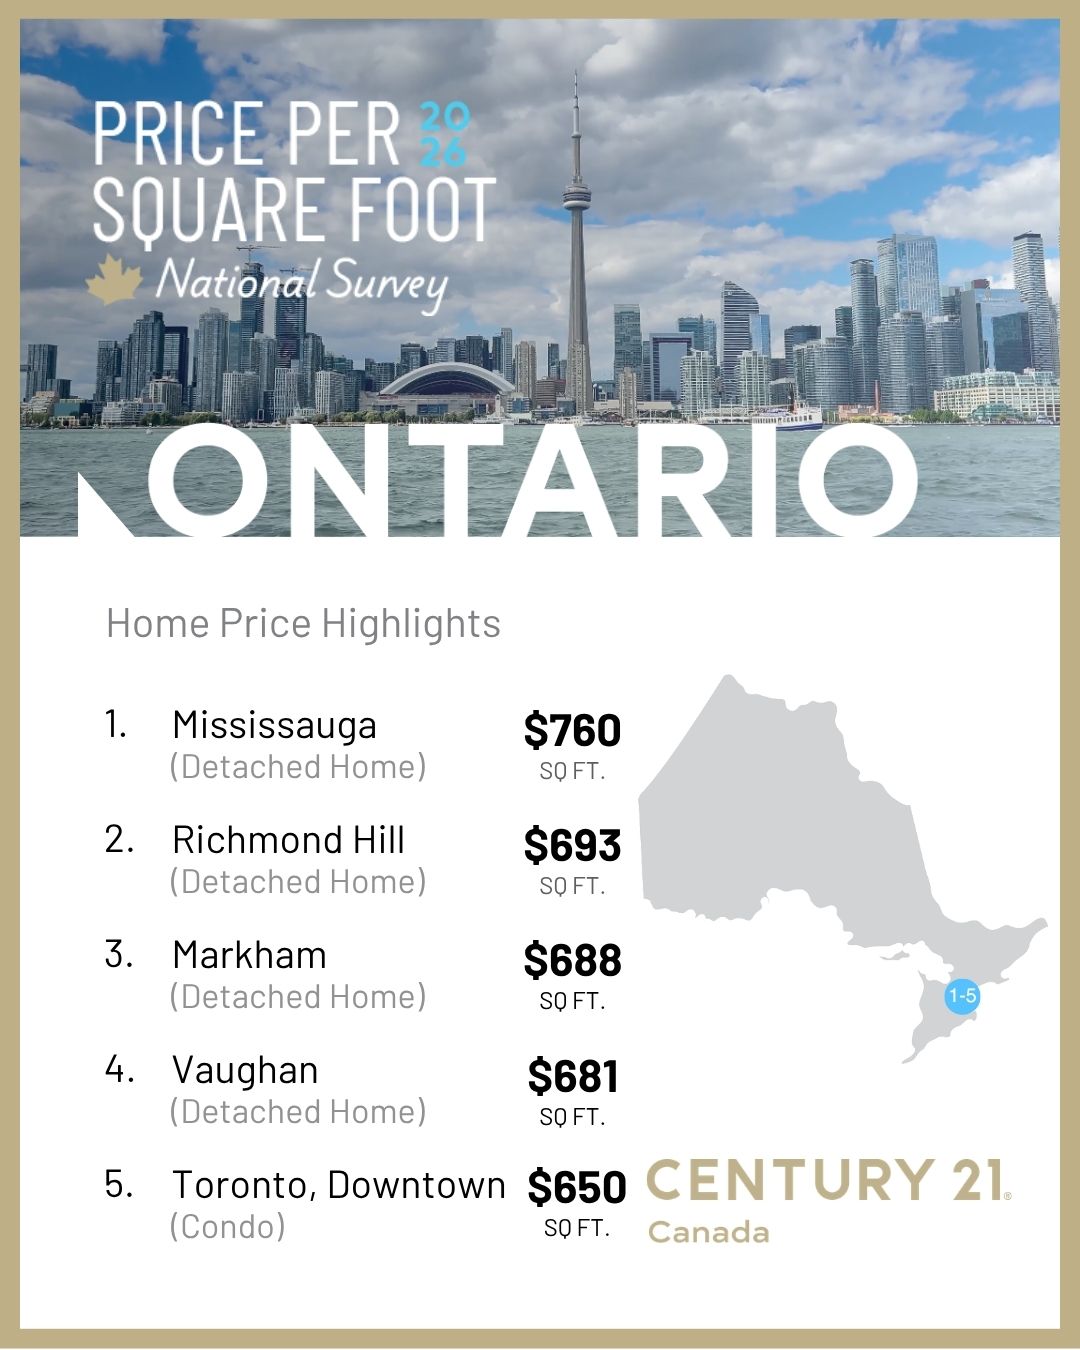
Ontario markets have experienced a difficult first half of 2026, driven primarily by the lack of inventory. Several markets featured in this survey experienced months where no sales occurred at all, and depressed prices across all markets add to very tough conditions for those in the real estate industry in this province.
Nelson Goulart, owner of CENTURY 21 Signature Service in Mississauga, ON, notes that the decline has been steady since 2022. “Real estate has always been driven by economic and political factors. Right now we have two wars happening in the world and tariffs being leveled against Canada. To offset these things, everything we know about how Canada operates has had to change. I believe we’re at the bottom of this market, so even though we’ve been bruised by the start of this year there’s some optimism for the fall markets.”
In Goulart’s own Mississauga (a new addition to the survey this year), detached homes hold one of the highest price points, which speaks to the city’s strengths of proximity and its strong industrial base. “We’re close to Toronto, we have a university campus and Toronto Pearson airport is right here. All together, I think that’s why you see stronger prices in the Mississauga area. We’re the first to be impacted when prices go down, and we’re the first to feel the change when they go up.”
Prairies
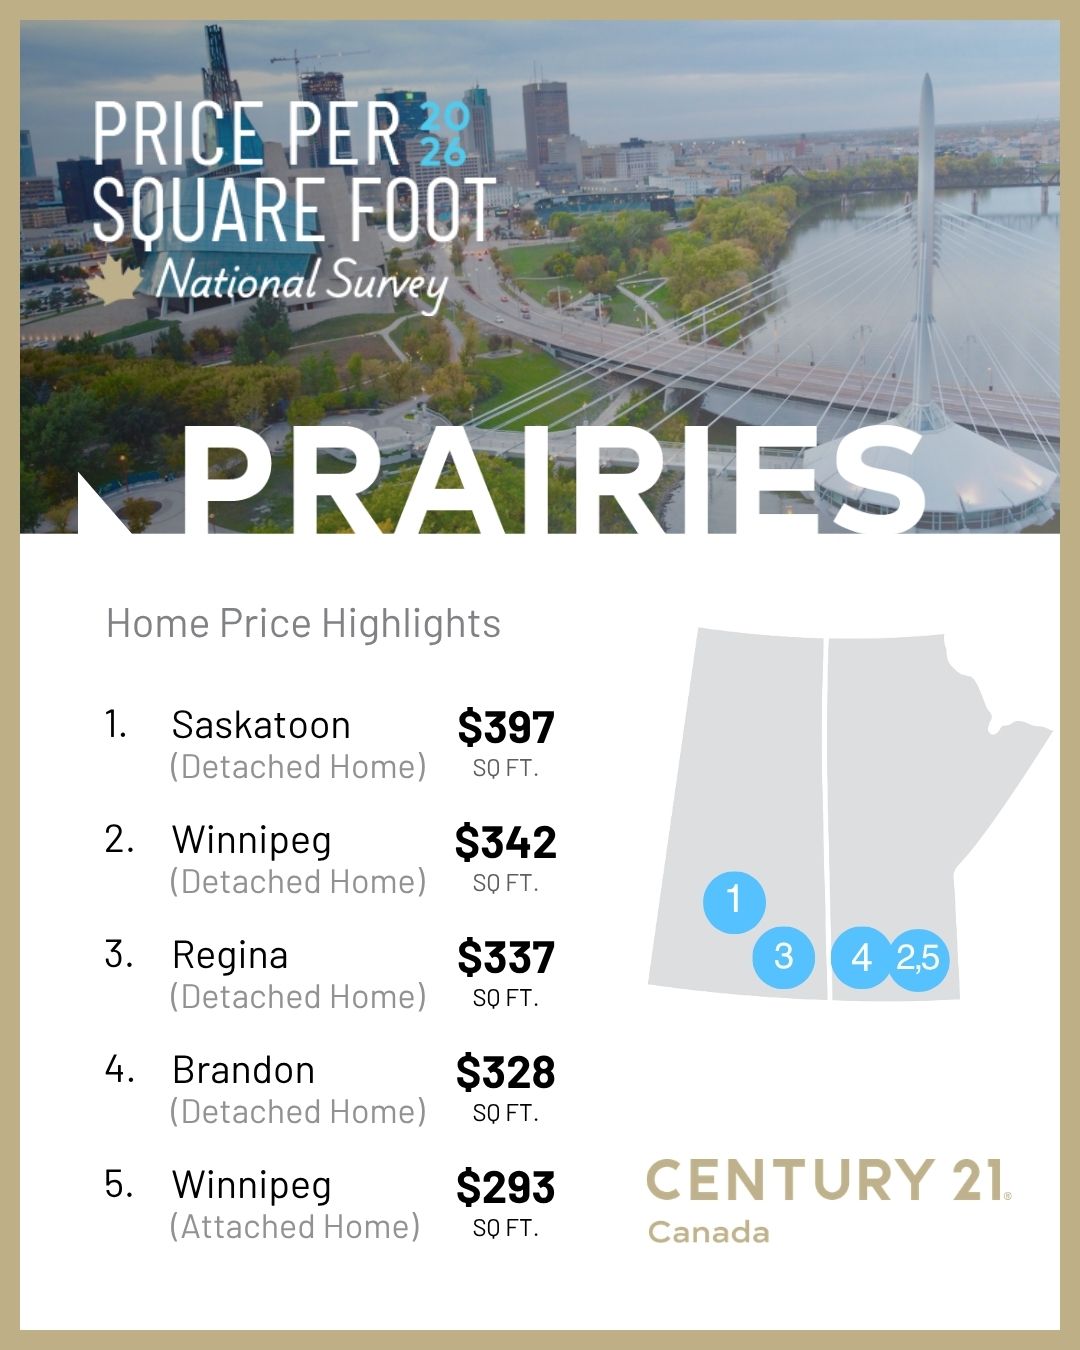
The Prairie provinces have the distinction of the strongest markets in Canada at the moment, continuing a trend of previous years. Detached homes in Regina gained 13 per cent, the highest increase in Canada, with Brandon, Winnipeg and Saskatoon following close behind in that same category. Only condos in Regina and Brandon saw small dips, as buyers continue to take advantage of the pricing and space to search for family homes.
Alberta
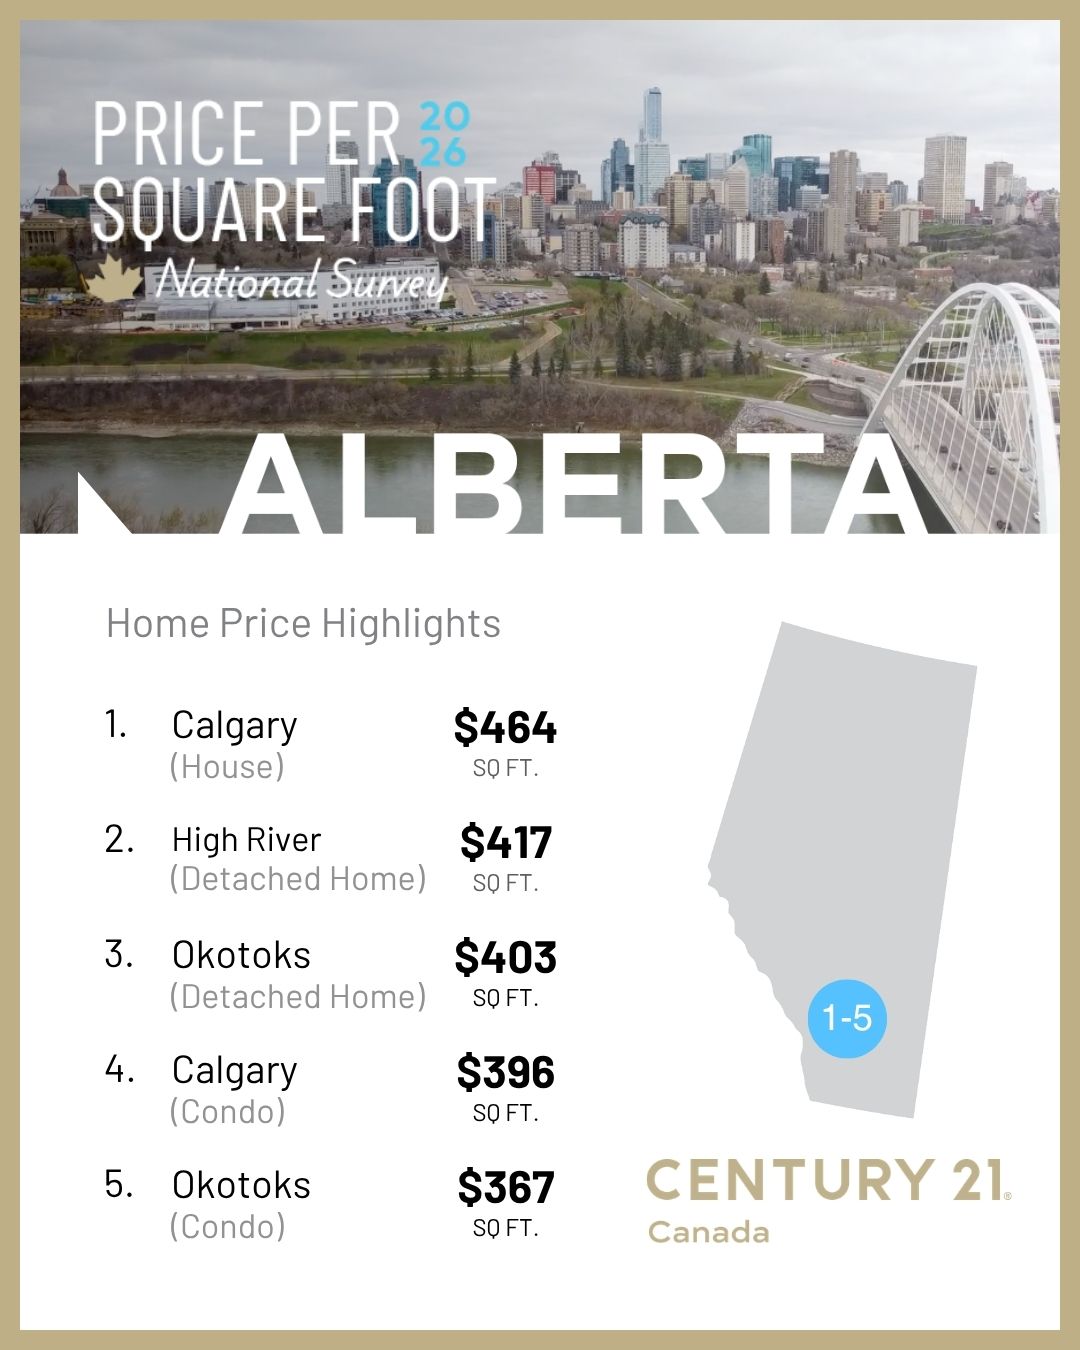
While there were drops to PPSF across Alberta this year (a turnaround from 2025 when it was the only province to rise across the board), they were modest. Markets have held steady in the cities of Calgary and Edmonton, while smaller communities such as Red Deer and St. Albert have seen increases.
“We’ve definitely had a slower start to the selling market,” says Geneva Tetrault, owner of CENTURY 21 Masters in Edmonton, AB. “What’s happened is that we’ve really settled into a balanced market. There are transactions happening, the agents are busy selling, but there’s less of the urgency and panic around every transaction that we’ve seen in the past.”
Tetrault observes that while fringe buyers who may have wanted to jump into a busy market have left, the core group of buyers who are buying and selling their homes based on life events will always be there and now have the opportunity to make those decisions with some breathing room. “There are people who might need a bigger house, who might want to downsize, who are experiencing changes in their families. They will always make up a base of ‘need-oriented’ transactions. The heat of the market may have kept them sitting on the sidelines for a little while, but now we’re seeing them come forward as inventory has had the chance to build up a little again.”
CENTURY 21 Canada’s annual survey of data on the price per square foot (PPSF) of properties gathers and compares sales data from its franchises across Canada from January 1 to June 30 of each year. By looking at the price per square foot at the same time each year the firm is able to get a good idea of how prices have changed over time for similar properties. This year’s survey compares 2025 prices with this year’s results.
Price Per Square Foot Survey Results 2026
| CITY | HOUSE TYPE | 2018 | 2019 | 2020 | 2021 | 2022 | 2023 | 2024 | 2025 | 2026 | % Change from 2025 |
| ALBERTA | |||||||||||
| Calgary | House | $341 | $325 | $320 | $355 | $396 | $419 | $470 | $474 | $464 | -2.11% |
| Calgary | Condo | $329 | $317 | $296 | $303 | $326 | $358 | $421 | $422 | $396 | -6.16% |
| Edmonton | Detached House | $288 | $272 | $268 | $284 | $297 | $309 | $317 | $341 | $344 | 0.88% |
| Edmonton | Duplex | $275 | $256 | $250 | $270 | $287 | $292 | $303 | $316 | $309 | -2.22% |
| Edmonton | Condo | $231 | $220 | $206 | $217 | $222 | $204 | $224 | $241 | $237 | -1.66% |
| High River | Detached House | $193 | $215 | $237 | $271 | $307 | $334 | $382 | $421 | $417 | -0.95% |
| High River | Condo | N/A | $241 | $173 | $176 | $223 | $233 | $285 | $290 | $298 | 2.76% |
| Okotoks | Detached House | N/A | $238 | $254 | $283 | $338 | $362 | $394 | $404 | $403 | -0.25% |
| Okotoks | Condo | N/A | $254 | $211 | $219 | $251 | $288 | $323 | $371 | $367 | -1.08% |
| Red Deer | Detached House | $276 | $262 | $252 | $289 | $293 | $294 | $325 | $359 | $360 | 0.28% |
| Red Deer | Townhouse | N/A | N/A | N/A | $207 | $214 | $226 | $222 | $263 | $282 | 7.22% |
| St. Albert | Detached House | $287 | $271 | $269 | $289 | $322 | $317 | $322 | $349 | $362 | 3.72% |
| St. Albert | Condo | $239 | $223 | $211 | $251 | $238 | $259 | $255 | $273 | $273 | 0.00% |
| St. Albert | Duplex | $262 | $272 | $278 | $280 | $325 | $347 | $301 | $336 | $348 | 3.57% |
| BRITISH COLUMBIA | 2018 | 2019 | 2020 | 2021 | 2022 | 2023 | 2024 | 2025 | 2026 | % Change from 2025 | |
| Chilliwack | Detached House | $432 | $438 | $436 | $570 | $724 | $617 | $635 | $643 | $628 | -2.33% |
| Chilliwack | Townhouse | $325 | $312 | $320 | $406 | $520 | $439 | $468 | $452 | $438 | -3.10% |
| Chilliwack | Condo/ Apartment | $284 | $291 | $283 | $334 | $468 | $429 | $445 | $424 | $456 | 7.55% |
| Kelowna | Detached House | $283 | $274 | $280 | $368 | $463 | $413 | $417 | $408 | $410 | 0.49% |
| Kelowna | Half Duplex | $247 | $260 | $263 | $320 | $402 | $362 | $393 | $366 | $362 | -1.09% |
| Kelowna | Townhouse | $292 | $287 | $302 | $365 | $452 | $422 | $422 | $422 | $395 | -6.40% |
| Kelowna | Apartment | $345 | $348 | $334 | $411 | $526 | $491 | $482 | $467 | $460 | -1.50% |
| Abbotsford | Detached House | $779 | |||||||||
| Langley | Detached House | $859 | |||||||||
| Surrey | Detached House | $660 | |||||||||
| Vancouver | Detached House | $856 | $769 | $816 | $975 | $1,177 | $1,034 | $1,071 | $998 | $933 | -6.51% |
| Vancouver, Downtown | Condo | $856 | $769 | $1,060 | $1,053 | $1,133 | $1,132 | $1,264 | $1,206 | $1,026 | -14.93% |
| Vancouver, East side | Detached House | $721 | $647 | $672 | $877 | $957 | $829 | $977 | $945 | $807 | -14.60% |
| Vancouver, West Side | Detached House | $1,147 | $990 | $1,004 | $1,208 | $1,421 | $1,149 | $1,161 | $1,110 | $1,072 | -3.42% |
| Burnaby | Detached House | $599 | $551 | $579 | $688 | $795 | $879 | $900 | $791 | $712 | -9.99% |
| West Van | Detached House | $899 | $738 | $734 | $971 | $1,038 | $930 | $1,037 | $958 | $853 | -10.96% |
| Vancouver, Richmond | Detached House | $677 | $598 | $608 | $722 | $831 | $773 | $831 | $776 | $698 | -10.05% |
| Delta North | Detached House | $423 | $400 | $413 | $570 | $716 | $594 | $618 | $594 | $546 | -8.08% |
| North Vancouver | Detached House | $681 | $613 | $690 | $794 | $910 | $817 | $937 | $922 | $814 | -11.71% |
| White Rock/South Surrey | Detached House | $506 | $472 | $435 | $625 | $795 | $627 | $724 | $689 | $603 | -12.48% |
| Victoria | Detached House | N/A | N/A | N/A | N/A | $907 | $818 | $818 | $875 | $860 | -1.71% |
| Victoria | Townhouse | N/A | N/A | N/A | N/A | $780 | $645 | $665 | $652 | $630 | -3.37% |
| Victoria | Condo | N/A | N/A | N/A | N/A | $736 | $664 | $672 | $681 | $671 | -1.47% |
| ATLANTIC | 2018 | 2019 | 2020 | 2021 | 2022 | 2023 | 2024 | 2025 | 2026 | % Change from 2025 | |
| Charlottetown | Detached House | $147 | $165 | $178 | $211 | $245 | $235 | $252 | $250 | $256 | 2.40% |
| Fredericton | Detached House | N/A | $99 | $123 | $147 | $170 | $196 | $196 | $248 | $230 | -7.26% |
| Halifax | Detached House | $155 | $162 | $170 | $281 | $408 | $398 | $414 | $436 | $438 | 0.46% |
| Halifax | Condo | $228 | $239 | $270 | $291 | $450 | $467 | $467 | $461 | $448 | -2.82% |
| Moncton | Detached House | $101 | $106 | $124 | $142 | $173 | $197 | $237 | $244 | $236 | -3.28% |
| Saint John | Detached House | N/A | $111 | $123 | $134 | $163 | $192 | $186 | $246 | $229 | -6.91% |
| St. John’s | Detached House | N/A | $132 | $135 | $149 | $167 | $167 | $226 | $340 | $333 | -2.06% |
| St. John’s | Condo | N/A | $174 | $116 | $182 | $212 | $205 | $310 | $353 | $322 | -8.78% |
| PRAIRIES | 2018 | 2019 | 2020 | 2021 | 2022 | 2023 | 2024 | 2025 | 2026 | % Change from 2025 | |
| Regina | Detached House | $254 | $246 | $237 | $250 | $284 | $275 | $290 | $298 | $337 | 13.09% |
| Regina | Condo | $236 | $213 | $205 | $205 | $194 | $189 | $227 | $227 | $225 | -0.88% |
| Saskatoon | Detached House | $270 | $263 | $263 | $314 | $336 | $344 | $370 | $377 | $397 | 5.31% |
| Saskatoon | Condo | $208 | $213 | $217 | $216 | $219 | $226 | $247 | $265 | $288 | 8.68% |
| Winnipeg | Detached House | $282 | $243 | $244 | $293 | $315 | $291 | $302 | $328 | $342 | 4.27% |
| Winnipeg | Condo | $261 | $220 | $223 | $234 | $254 | $249 | $271 | $267 | $271 | 1.50% |
| Winnipeg | Attached | N/A | $202 | $210 | $241 | $269 | $258 | $272 | $288 | $293 | 1.74% |
| Brandon | Detached House | $248 | $246 | $248 | $271 | $276 | $276 | $291 | $299 | $328 | 9.70% |
| Brandon | Condo | $196 | $204 | $204 | $203 | $243 | $236 | $234 | $269 | $262 | -2.60% |
| ONTARIO | 2018 | 2019 | 2020 | 2021 | 2022 | 2023 | 2024 | 2025 | 2026 | % Change from 2025 | |
| Barrie | Detached House | $283 | $350 | $350 | $378 | $503 | $576 | $579 | $600 | $546 | -9.00% |
| Bradford | Detached House | $286 | $345 | $358 | $410 | $580 | $535 | $530 | $569 | $524 | -7.91% |
| Cambridge | Detached House | $332 | $355 | $388 | $450 | $625 | $568 | $568 | $555 | $550 | -0.90% |
| Cambridge | Condo | $344 | $347 | $367 | $435 | $716 | $514 | $530 | $517 | $477 | -7.74% |
| Cambridge | Townhouse | $282 | $317 | $341 | $474 | $616 | $490 | $500 | $519 | $460 | -11.37% |
| Grey Bruce | Detached House | $175 | $182 | $195 | $357 | $659 | $561 | $613 | $541 | $540 | -0.18% |
| Guelph | Detached House | $397 | $409 | $443 | $483 | $690 | $686 | $672 | $668 | $639 | -4.34% |
| Guelph | Condo | $374 | $402 | $423 | $511 | $777 | $601 | $617 | $548 | $505 | -7.85% |
| Guelph | Duplex | $348 | $362 | $400 | $451 | $641 | $557 | $547 | $551 | $501 | -9.07% |
| Guelph | Townhouse | $311 | $335 | $364 | $433 | $510 | $429 | $413 | $391 | $373 | -4.60% |
| Hamilton | Detached House | $362 | $378 | $406 | $532 | $637 | $565 | $444 | $337 | $356 | 5.64% |
| Hamilton | Townhouse | $257 | $350 | $343 | $453 | $478 | $394 | $390 | $432 | $377 | -12.73% |
| Kitchener | Detached House | $339 | $359 | $400 | $430 | $618 | $610 | $605 | $598 | $590 | -1.34% |
| Kitchener | Townhouse | N/A | $323 | $342 | $435 | $576 | $487 | $490 | $470 | $465 | -1.06% |
| Kitchener | Condo | $328 | $362 | $399 | $483 | $800 | $516 | $491 | $446 | $404 | -9.42% |
| London | Detached House | $191 | $237 | $250 | $362 | $602 | $498 | $492 | $498 | $478 | -4.02% |
| Mississauga | Detached House | $760 | |||||||||
| Mississauga | Condo | $542 | |||||||||
| Markham | Detached House | N/A | N/A | $485 | $557 | $685 | $841 | $802 | $751 | $688 | -8.39% |
| Niagara Falls | Detached House | N/A | $275 | $300 | $390 | $531 | $514 | $505 | $503 | $476 | -5.37% |
| Newmarket | Detached House | N/A | $372 | $510 | $505 | $516 | $704 | $695 | $650 | $582 | -10.46% |
| Ottawa | Detached House | $225 | $258 | $313 | $429 | $465 | $587 | $607 | $741 | $639 | -13.77% |
| Ottawa | Townhouse | N/A | N/A | N/A | $392 | $451 | $566 | $534 | $618 | $507 | -17.96% |
| Ottawa | Condo | $442 | $485 | $577 | $479 | $583 | $538 | $550 | $594 | $592 | -0.34% |
| Owen Sound | Detached House | $145 | $158 | $167 | $312 | $380 | $361 | $362 | $391 | $382 | -2.30% |
| Richmond Hill | Detached House | $445 | $465 | $522 | $520 | $665 | $813 | $835 | $768 | $693 | -9.77% |
| Sault Ste. Marie | Detached House | $298 | $306 | $276 | -9.80% | ||||||
| Sault Ste. Marie | Condo | $328 | $296 | $340 | 14.86% | ||||||
| St. Catharines | Detached House | $310 | $290 | $330 | $400 | $612 | $528 | $523 | $567 | $493 | -13.05% |
| Toronto, Downtown | Condo | $903 | $994 | $1,083 | $956 | $792 | $739 | $734 | $705 | $650 | -7.80% |
| Vaughn | Detached House | $434 | $503 | $548 | $612 | $695 | $772 | $791 | $737 | $681 | -7.60% |
| Waterloo | Detached House | N/A | $372 | $407 | $421 | $613 | $603 | $601 | $674 | $642 | -4.75% |
| Waterloo | Townhouse | N/A | $324 | $344 | $408 | $641 | $486 | $489 | $531 | $459 | -13.56% |
| Waterloo | Condo | N/A | $402 | $411 | $503 | $777 | $525 | $498 | $571 | $508 | -11.03% |
| Windsor | Detached House | N/A | $372 | $407 | $295 | $306 | $469 | $364 | $394 | $362 | -8.12% |
| QUEBEC | 2018 | 2019 | 2020 | 2021 | 2022 | 2023 | 2024 | 2025 | 2026 | % Change from 2025 | |
| Montreal, Downtown and SW | Condo | $282 | $289 | $431 | $498 | $456 | $439 | $517 | $545 | $544 | -0.18% |
| Montreal, Downtown and SW | Detached House | $211 | $222 | $366 | $433 | $500 | $467 | $485 | $523 | $553 | 5.74% |